

Cytotoxicity of surface-functionalized silicon and germanium nanoparticles: the dominant role of surface charges
- PMID: 23619571
- PMCID: PMC3667208
- DOI: 10.1039/c3nr34266b
Cytotoxicity of surface-functionalized silicon and germanium nanoparticles: the dominant role of surface charges
Abstract
Although it is frequently hypothesized that surface (like surface charge) and physical characteristics (like particle size) play important roles in cellular interactions of nanoparticles (NPs), a systematic study probing this issue is missing. Hence, a comparative cytotoxicity study, quantifying nine different cellular endpoints, was performed with a broad series of monodisperse, well characterized silicon (Si) and germanium (Ge) NPs with various surface functionalizations. Human colonic adenocarcinoma Caco-2 and rat alveolar macrophage NR8383 cells were used to clarify the toxicity of this series of NPs. The surface coatings on the NPs appeared to dominate the cytotoxicity: the cationic NPs exhibited cytotoxicity, whereas the carboxylic acid-terminated and hydrophilic PEG- or dextran-terminated NPs did not. Within the cationic Si NPs, smaller Si NPs were more toxic than bigger ones. Manganese-doped (1% Mn) Si NPs did not show any added toxicity, which favors their further development for bioimaging. Iron-doped (1% Fe) Si NPs showed some added toxicity, which may be due to the leaching of Fe(3+) ions from the core. A silica coating seemed to impart toxicity, in line with the reported toxicity of silica. Intracellular mitochondria seem to be the target for the toxic NPs since a dose-, surface charge- and size-dependent imbalance of the mitochondrial membrane potential was observed. Such an imbalance led to a series of other cellular events for cationic NPs, like decreased mitochondrial membrane potential (ΔΨm) and ATP production, induction of ROS generation, increased cytoplasmic Ca(2+) content, production of TNF-α and enhanced caspase-3 activity. Taken together, the results explain the toxicity of Si NPs/Ge NPs largely by their surface characteristics, provide insight into the mode of action underlying the observed cytotoxicity, and give directions on synthesizing biocompatible Si and Ge NPs, as this is crucial for bioimaging and other applications in for example the field of medicine.
Figures
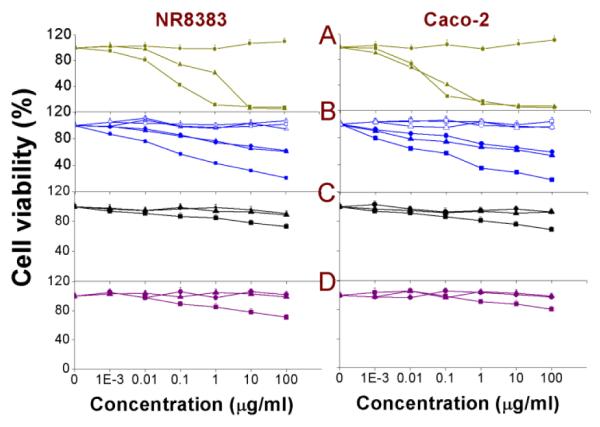
 ), Si(1.6) NP-N3 (
 ) and Si(1.6) NP-COOH (
 ); (B) SiFe(3.9) NP-NH2 (∎), Si(3.9) NP-NH2 (▴), SiMn(3.9) NP-NH2 (●),SiFe(3.9) NP-NH2-Dex (
 ), Si(3.9) NP-NH2-Dex (
 ) and SiMn(3.9) NP-NH2-Dex (
 ); (C) Ge NP-TMPA (∎), Ge NP-PEG (▴) and Si NP-PEG (●); (D) Si NP-Sil (
 ), Si NP-UDA (
 ) and Si NP-Pol (
 ). Results are shown as mean ± standard error of mean (SEM) (n = 3).
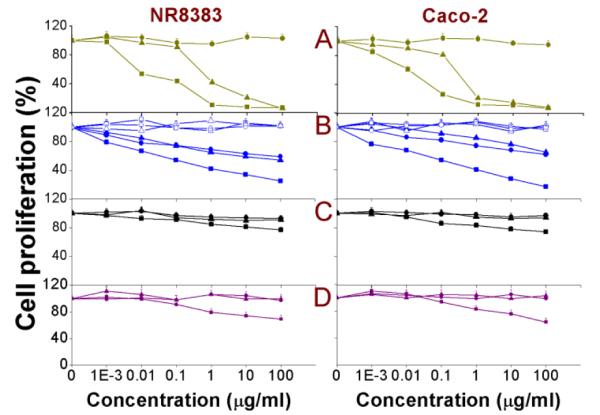
 ), Si(1.6) NP-N3 (
 ) and Si(1.6) NP-COOH (
 ); (B) SiFe(3.9) NP-NH2 (∎), Si(3.9) NP-NH2 (▴), SiMn(3.9) NP-NH2 (●), SiFe(3.9) NP-NH2-Dex (
 ), Si(3.9) NP-NH2-Dex (
 ) and SiMn(3.9) NP-NH2-Dex (
 ); (C) Ge NP-TMPA (∎), Ge NP-PEG (▴) and Si NP-PEG (●); (D) Si NP-Sil (
 ), Si NP-UDA (
 ) and Si NP-Pol (
 ). Results are shown as mean ± SEM (n = 3).
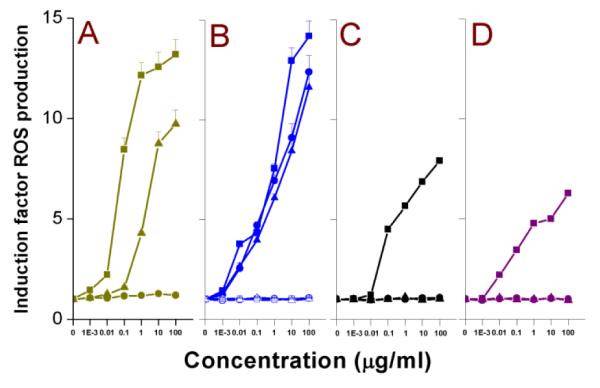
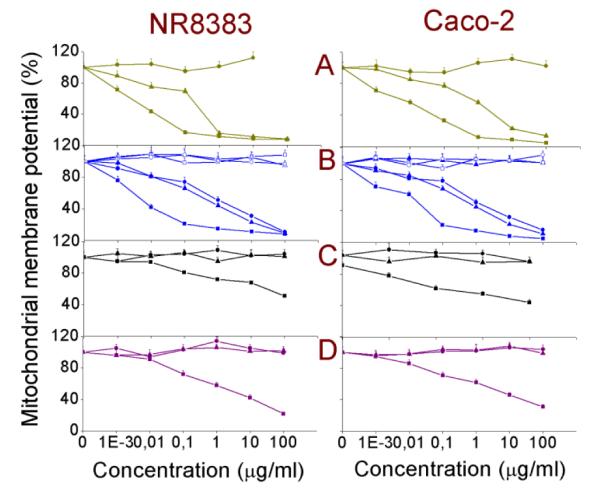
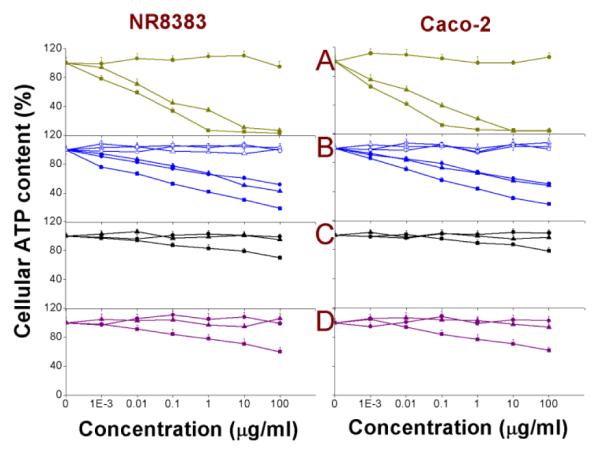
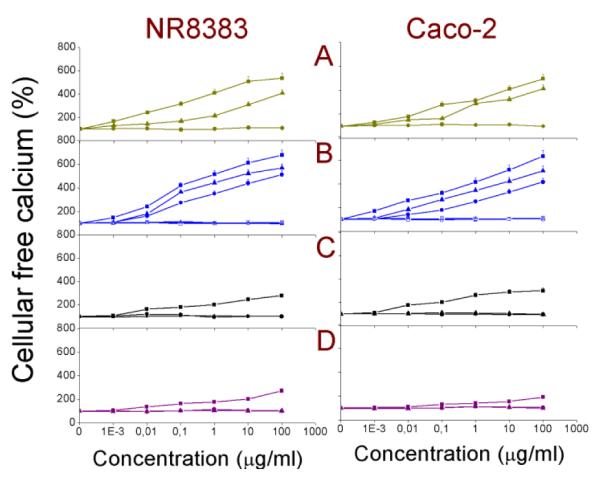
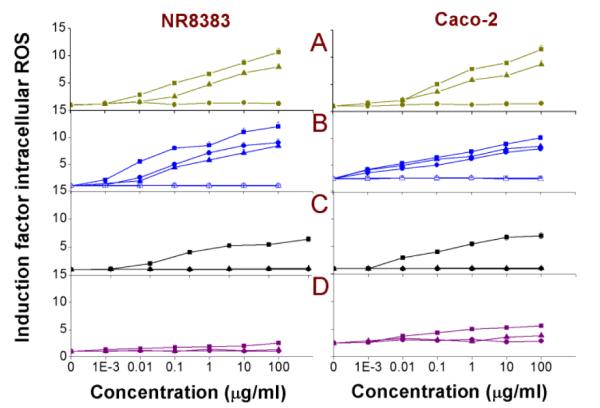
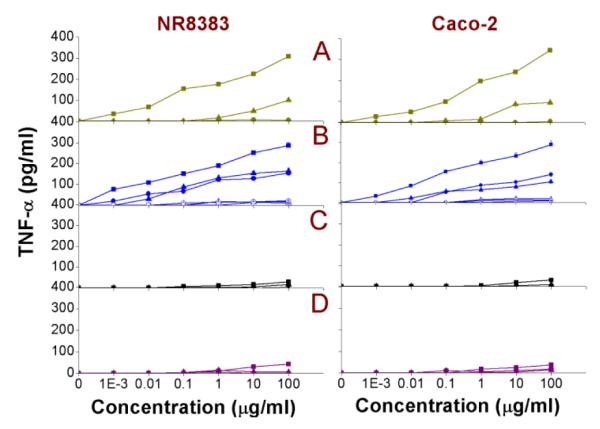
 ), Si(1.6) NP-N3 (
 ) and Si(1.6) NP-COOH (
 ); (B) SiFe(3.9) NP-NH2 (∎), Si(3.9) NP-NH2 (▴), SiMn(3.9) NP-NH2 (●), SiFe(3.9) NP-NH2-Dex (
 ), Si(3.9) NP-NH2-Dex (
 ) and SiMn(3.9) NP-NH2-Dex (
 ); (C) Ge NP-TMPA (∎), Ge NP-PEG (▴) and Si NP-PEG (●); (D) Si NP-Sil (
 ), Si NP-UDA (
 ) and Si NP-Pol (
 ). Results are shown as mean ± SEM (n=3).
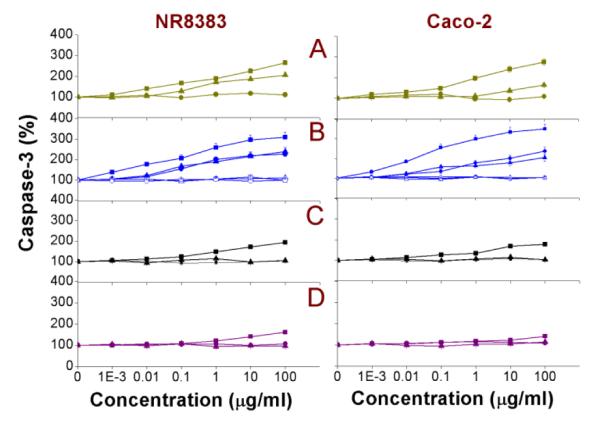
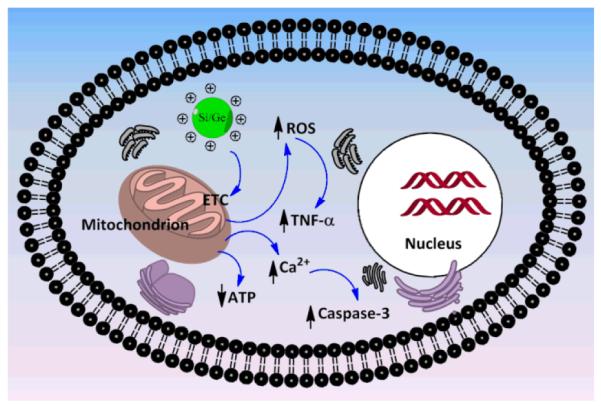
Similar articles
-
Role of surface charge and oxidative stress in cytotoxicity of organic monolayer-coated silicon nanoparticles towards macrophage NR8383 cells.Part Fibre Toxicol. 2010 Sep 11;7:25. doi: 10.1186/1743-8977-7-25. Part Fibre Toxicol. 2010. PMID: 20831820 Free PMC article.
-
Cytotoxicity and cellular uptake of tri-block copolymer nanoparticles with different size and surface characteristics.Part Fibre Toxicol. 2012 Apr 30;9:11. doi: 10.1186/1743-8977-9-11. Part Fibre Toxicol. 2012. PMID: 22546147 Free PMC article.
-
Influence of silica nanoparticles on cadmium-induced cytotoxicity, oxidative stress, and apoptosis in human liver HepG2 cells.Environ Toxicol. 2020 May;35(5):599-608. doi: 10.1002/tox.22895. Epub 2020 Jan 6. Environ Toxicol. 2020. PMID: 31904905
-
Solution Synthesis, Surface Passivation, Optical Properties, Biomedical Applications, and Cytotoxicity of Silicon and Germanium Nanocrystals.Chempluschem. 2017 Jan;82(1):60-73. doi: 10.1002/cplu.201600207. Epub 2016 Jun 27. Chempluschem. 2017. PMID: 31961504 Review.
-
Solution synthesis, optical properties, and bioimaging applications of silicon nanocrystals.Acc Chem Res. 2014 Oct 21;47(10):3045-51. doi: 10.1021/ar500215v. Epub 2014 Sep 25. Acc Chem Res. 2014. PMID: 25252604 Review.
Cited by
-
Influence of Physicochemical Characteristics and Stability of Gold and Silver Nanoparticles on Biological Effects and Translocation across an Intestinal Barrier-A Case Study from In Vitro to In Silico.Nanomaterials (Basel). 2021 May 21;11(6):1358. doi: 10.3390/nano11061358. Nanomaterials (Basel). 2021. PMID: 34063963 Free PMC article.
-
The protein corona protects against size- and dose-dependent toxicity of amorphous silica nanoparticles.Beilstein J Nanotechnol. 2014 Aug 27;5:1380-92. doi: 10.3762/bjnano.5.151. eCollection 2014. Beilstein J Nanotechnol. 2014. PMID: 25247121 Free PMC article.
-
Si nanocrystal solution with stability for one year.RSC Adv. 2018 Dec 11;8(72):41299-41307. doi: 10.1039/c8ra08816k. eCollection 2018 Dec 7. RSC Adv. 2018. PMID: 35559330 Free PMC article.
-
Non-toxic engineered carbon nanodiamond concentrations induce oxidative/nitrosative stress, imbalance of energy metabolism, and mitochondrial dysfunction in microglial and alveolar basal epithelial cells.Cell Death Dis. 2018 Feb 14;9(2):245. doi: 10.1038/s41419-018-0280-z. Cell Death Dis. 2018. PMID: 29445138 Free PMC article.
-
Tantalum oxide nanoparticles for the imaging of articular cartilage using X-ray computed tomography: visualization of ex vivo/in vivo murine tibia and ex vivo human index finger cartilage.Angew Chem Int Ed Engl. 2014 Aug 4;53(32):8406-10. doi: 10.1002/anie.201404519. Epub 2014 Jun 30. Angew Chem Int Ed Engl. 2014. PMID: 24981730 Free PMC article.
References
-
- Luo XL, Morrin A, Killard AJ, Smyth MR. Electroanalysis. 2006;18:319–326.
-
- Lee JH, Huh YM, Jun Y, Seo J, Jang J, Song HT, Kim S, Cho EJ, Yoon HG, Suh JS, Cheon J. Nat. Med. 2007;13:95–99. - PubMed
-
- Zhang L, Gu FX, Chan JM, Wang AZ, Langer RS, Farokhzad OC. Clin. Pharmacol. Ther. 2007;83:761–769. - PubMed
-
- Buzea C, Pacheco I, Robbie K. Biointerphases. 2007;2:MR17–MR71. - PubMed
Publication types
MeSH terms
Substances
Grants and funding
LinkOut - more resources
Full Text Sources
Other Literature Sources
Research Materials
Miscellaneous