. 2013 Apr 25;496(7446):486-9.
doi: 10.1038/nature12072.

Optical magnetic imaging of living cells

Affiliations

Optical magnetic imaging of living cells

D Le Sage et al. Nature. .

Abstract

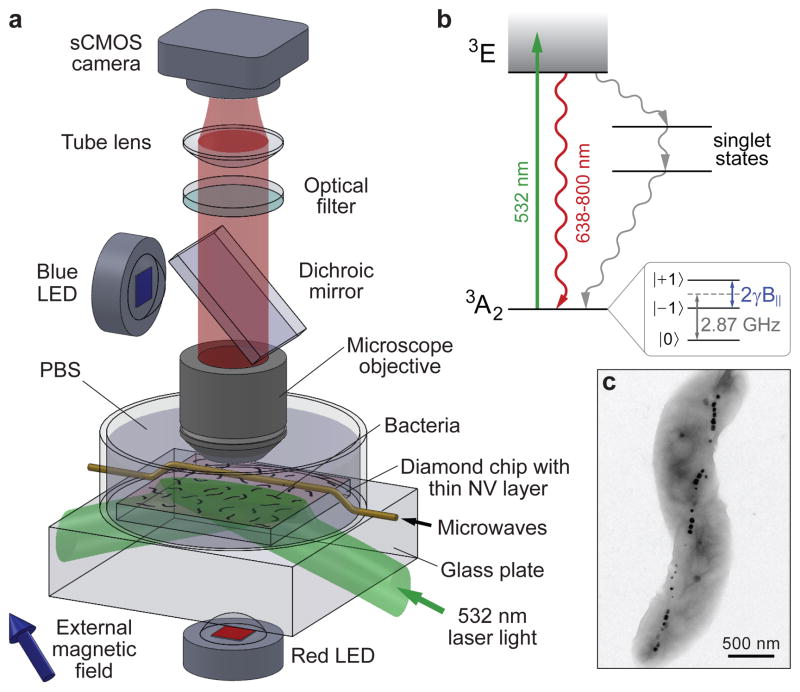
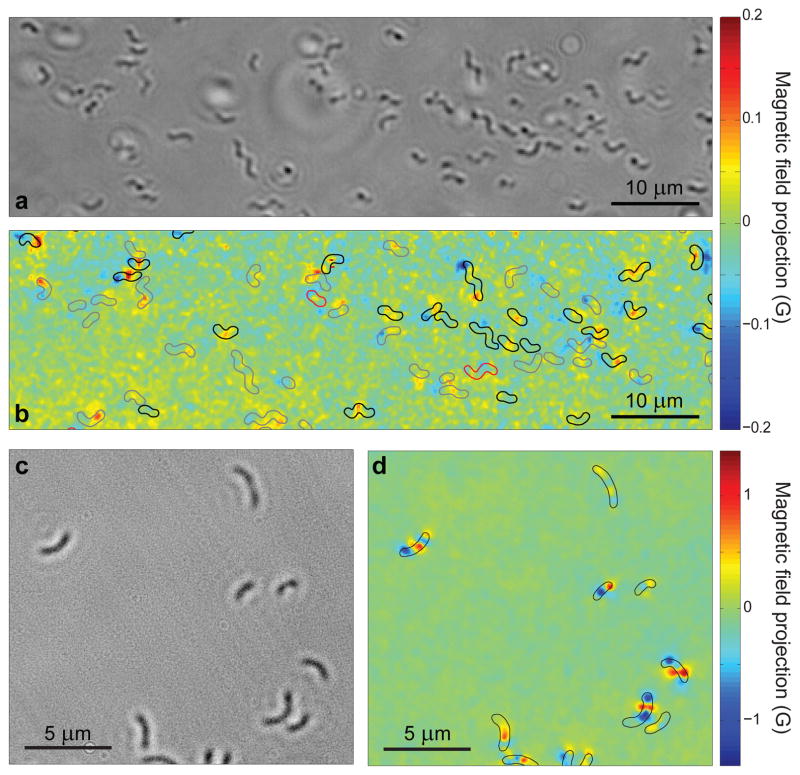
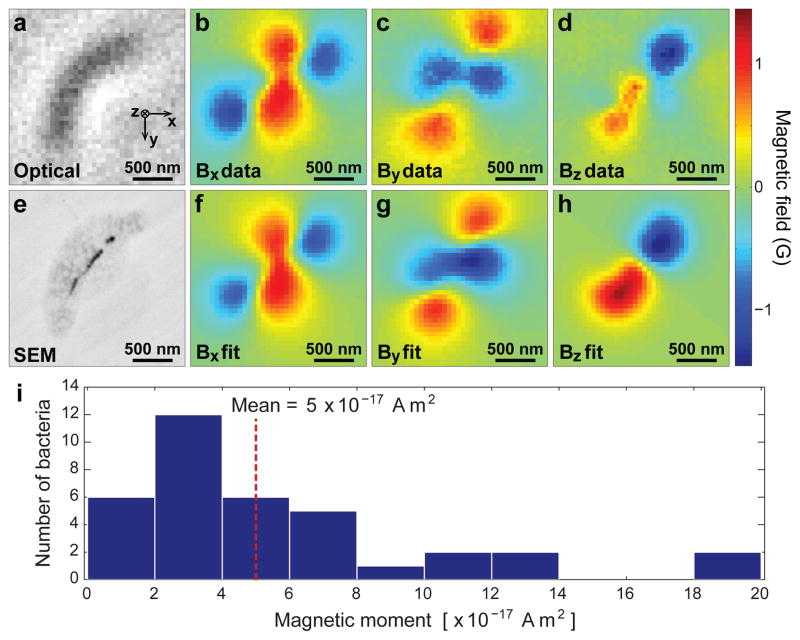
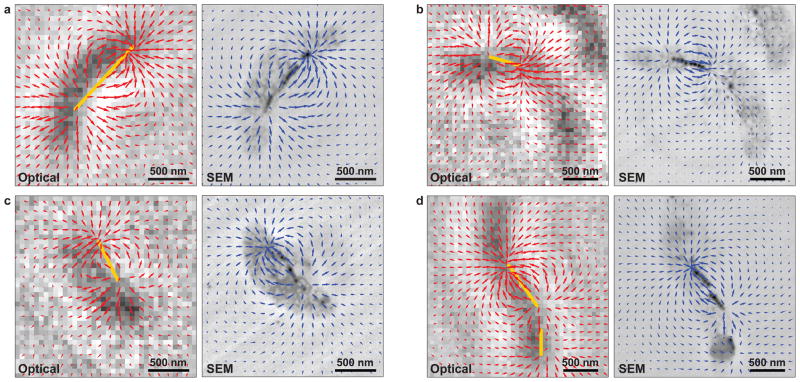
Magnetic imaging is a powerful tool for probing biological and physical systems. However, existing techniques either have poor spatial resolution compared to optical microscopy and are hence not generally applicable to imaging of sub-cellular structure (for example, magnetic resonance imaging), or entail operating conditions that preclude application to living biological samples while providing submicrometre resolution (for example, scanning superconducting quantum interference device microscopy, electron holography and magnetic resonance force microscopy). Here we demonstrate magnetic imaging of living cells (magnetotactic bacteria) under ambient laboratory conditions and with sub-cellular spatial resolution (400 nanometres), using an optically detected magnetic field imaging array consisting of a nanometre-scale layer of nitrogen-vacancy colour centres implanted at the surface of a diamond chip. With the bacteria placed on the diamond surface, we optically probe the nitrogen-vacancy quantum spin states and rapidly reconstruct images of the vector components of the magnetic field created by chains of magnetic nanoparticles (magnetosomes) produced in the bacteria. We also spatially correlate these magnetic field maps with optical images acquired in the same apparatus. Wide-field microscopy allows parallel optical and magnetic imaging of multiple cells in a population with submicrometre resolution and a field of view in excess of 100 micrometres. Scanning electron microscope images of the bacteria confirm that the correlated optical and magnetic images can be used to locate and characterize the magnetosomes in each bacterium. Our results provide a new capability for imaging bio-magnetic structures in living cells under ambient conditions with high spatial resolution, and will enable the mapping of a wide range of magnetic signals within cells and cellular networks.


Conflict of interest statement

Competing interests:

The authors declare that they have no competing financial interests.

Figures

Figure 1
Figure 1. Wide-field magnetic imaging microscope
a, Home-built wide-field fluorescence microscope used for combined optical and magnetic imaging. Live magnetotactic bacteria (MTB) are placed in phosphate-buffered saline (PBS) on the surface of a diamond chip implanted with nitrogen vacancy (NV) centres. Vector magnetic field images are derived from optically detected magnetic resonance (ODMR) interrogation of NV centres excited by a totally-internally-reflected 532 nm laser beam, and spatially correlated with bright field optical images. b, Energy-level diagram of NV centre; see Methods for details. c, Typical transmission electron microscope (TEM) image of a Magnetospirillum magneticum AMB-1 bacterium. Magnetite nanoparticles appear as spots of high electron density.
Figure 2
Figure 2. Wide-field optical and magnetic images of magnetotactic bacteria
a, Bright-field optical image of MTB adhered to the diamond surface while immersed in PBS. b, Image of magnetic field projection along the [111] crystallographic axis in the diamond for the same region as a, determined from NV ODMR. Superimposed outlines indicate MTB locations determined from a. Outline colours indicate results of the live-dead assay performed after measuring the magnetic field (black for living, red for dead, and grey for indeterminate). c, Bright-field image of dried MTB on the diamond chip. d, Image of magnetic field projection along [111] for the same region, with outlines indicating MTB locations determined from c.
Figure 3
Figure 3. Determining magnetic moments of individual bacteria from measured magnetic field distributions
a, Bright-field image of an MTB. b–d, Measured magnetic field projections along the x, y, and z axes within the same field-of-view. e, Scanning electron microscope (SEM) image of the same bacterium. f–h, Simulated magnetic field projections along the x, y, and z axes, assuming that magnetic nanoparticle locations match those extracted from e. The total magnetic moment was determined from the best fit of the calculated field distribution to the measurement (see Methods for details). i, Magnetic moments of 36 randomly-sampled MTB, as determined from optical magnetic field images and modelled field distributions.
Figure 4
Figure 4. Localization of magnetosome chains using magnetic field measurements
a, Vector plots of the measured (red arrows) and simulated (blue arrows) magnetic field projections in the x-y plane, for the same MTB as in Figs. 3a–h, superimposed on the optical and backscattered electron images, respectively. The estimated location of the magnetosome chain inside the MTB (yellow line), as determined from the divergence of the measured magnetic field, coincides well with the magnetosome positions found by SEM. b–d, The same information as presented in a, but for three different MTB. In panel d, two distinct magnetosome chains are identified.

Comment in

References

    1. Lee SC, et al. MR microscopy of micron scale structures. Magn Reson Imaging. 2009;27:828–833. - PubMed
    1. Finkler A, et al. Self-Aligned Nanoscale SQUID on a Tip. Nano Lett. 2010;10 (3):1046–1049. - PubMed
    1. Dunin-Borkowski RE, et al. Magnetic Microstructure of Magnetotactic Bacteria by Electron Holography. Science. 1998;282:1868–1870. - PubMed
    1. Degen CL, Poggio M, Mamin HJ, Rettner CT, Rugar D. Nanoscale magnetic resonance imaging. Proc Natl Acad Sci USA. 2009;106:1313–1317. - PMC - PubMed
    1. Hall LT, et al. Monitoring ion-channel function in real time through quantum decoherence. Proc Natl Acad Sci USA. 2010;107 (44):18777–18782. - PMC - PubMed

Publication types