. 2013 Jul;62(7):1211-22.
doi: 10.1007/s00262-013-1412-z. Epub 2013 Apr 26.

EBV-transformed lymphoblastoid cell lines as vaccines against cancer testis antigen-positive tumors

Affiliations

EBV-transformed lymphoblastoid cell lines as vaccines against cancer testis antigen-positive tumors

Frank Neumann et al. Cancer Immunol Immunother. 2013 Jul.

Abstract

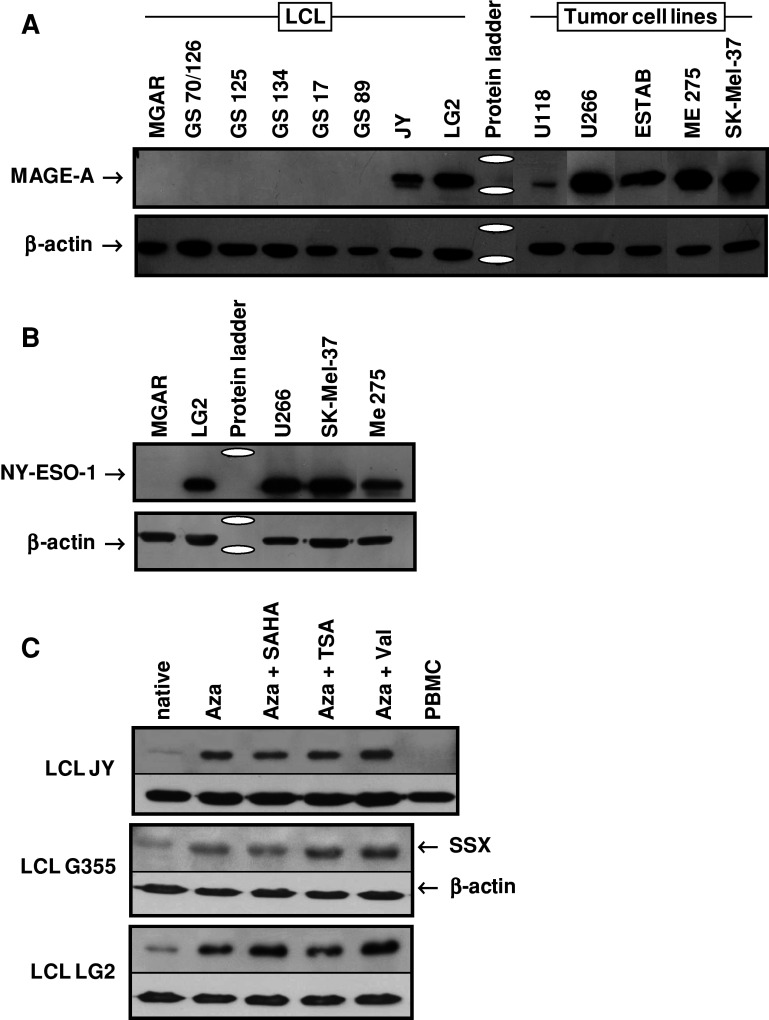
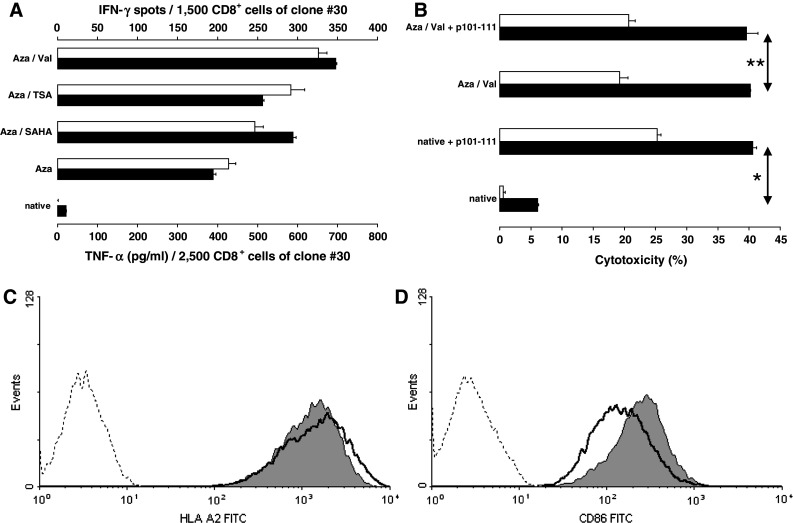
EBV-transformed lymphoblastoid cell lines (LCL) are potent antigen-presenting cells. To investigate their potential use as cancer testis antigen (CTA) vaccines, we studied the expression of 12 cancer testis (CT) genes in 20 LCL by RT-PCR. The most frequently expressed CT genes were SSX4 (50 %), followed by GAGE (45 %), SSX1 (40 %), MAGE-A3 and SSX2 (25 %), SCP1, HOM-TES-85, MAGE-C1, and MAGE-C2 (15 %). NY-ESO-1 and MAGE-A4 were found in 1/20 LCL and BORIS was not detected at all. Fifteen of 20 LCL expressed at least one antigen, 9 LCL expressed ≥2 CT genes, and 7 of the 20 LCL expressed ≥4 CT genes. The expression of CT genes did not correlate with the length of in vitro culture, telomerase activity, aneuploidy, or proliferation state. While spontaneous expression of CT genes determined by real-time PCR and Western blot was rather weak in most LCL, treatment with DNA methyltransferase 1 inhibitor alone or in combination with histone deacetylase inhibitors increased CTA expression considerably thus enabling LCL to induce CTA-specific T cell responses. The stability of the CT gene expression over prolonged culture periods makes LCL attractive candidates for CT vaccines both in hematological neoplasias and solid tumors.


Conflict of interest statement

None of the authors declares any conflict of interest.

Figures

Fig. 1
Fig. 1
Expression of CT genes in EBV-transformed lymphoblastoid cell lines (LCL) and quantitative expression of CT genes in LCL. a Frequency of the expression of 12 CT genes in 20 LCL. b Simultaneous co-expression of the 12 CT genes in 20 LCL. All results assessed by RT-PCR in multiply repeated tests. c Comparison of the strength of CT gene mRNA expression in 16 LCL with 10 tumor cell lines of different origin. The mRNA expression of 6/6 CT gene was higher in the tumor cell lines. d The expression of the different CT gene increased significantly after treatment of the LCL with the DNMT1 inhibitor 5-azacytidine alone or in combination with the HDAC inhibitors SAHA, TSA, or valproic acid. Y-axis (logarithmic scale!) shows the times of increase of CT gene expression in LCL ‘JY’ after treatment compared to the untreated cells with a base line expression factor of 1. Factor variations are caused by the variable efficiency of the 4 different ways of treatment (4 columns per CTA). All results were assessed by LightCycler PCR in multiple repeated tests and normalized to the expression of GAPDH
Fig. 2
Fig. 2
Expression of CT antigens at the protein level. Protein expression of the corresponding CT genes was analyzed by Western blot using β-actin as loading control. a With MGAR as CTA-negative control, all others LCL expressed MAGE-A3 and/or MAGE-A4 as assessed by RT-PCR. However, only cells from JY and LG2 also had these antigens at detectable protein levels. These levels were lower compared to those of the MAGE-A3/A4+ tumor cell lines. Antibody clone 6C1, which was used for detection, allowed no differentiation between MAGE-A3 and MAGE-A4. Blots of the different cell lines were analyzed in different runs and mounted to this slide. b LG2 was the only LCL of the 20 lines in this study which expressed NY-ESO-1 as assessed by RT-PCR. MGAR was used as NY-ESO-1-negative control LCL. c After treatment with 5-azacytidine to inhibit DNMT1 and different HDAC inhibitors, the expression of CTA was amplified in 3/3 LCL. Antibody of clone E3AS was used to detect SSX (a. o. SSX1, SSX2, and SSX4) as an example to demonstrate that the gene amplification leads to increased levels of the protein. In all LCL, the combined use of 5-azacytidine and valproic acid showed the strongest effect. For this analysis, PBMC were used as a CTA-negative control. All experiments were run twice and achieved the same results
Fig. 3
Fig. 3
Induction of T cell responses using LCL as CTA-expressing APC. a CD8+ T-cell clone #30, specific for the SSX2 epitope p101-111 in the context of HLA-A*0201, did not respond to untreated LCL ‘JY’ (HLA-A*0201 +) used as APC. However, after treatment with the DNMT1 inhibitor, Aza alone or in combination with one of the three HDAC inhibitors as described, T cells of clone #30, responded to these targets by secreting IFN-γ (unfilled bars) as well as TNF-α (black bars). Results were assessed by IFN-γ ELISPOT and TNF-α ELISA, respectively. b T cells of the same clone were induced to lyse native JY cells used as targets only after additional external loading with 2 μM peptide p101-111 (*p = 0.005). The difference between peptide-loaded or unloaded LCL disappeared after these LCL had been treated with a combination of Aza and Val (**p > 0.05) (p values determined by F test followed by 2-sided Student’s t test). Cytotoxicity was assessed by LDH release and calculated relatively compared to maximum lysis induced by lysing solution. Two different effector/target ratios, 4/1 (black bars) and 2/1 (unfilled bars), were applied. c The expression of MHC-I molecules under DNMT1/HDAC inhibition was analyzed by flow cytometry exemplarily for HLA-A2 (BB7.2 antibody). A small but significantly (∆GMean p = 0.00002) reduced expression of HLA-A2 molecules on LCL after treatment with valproic acid was detected (dotted line = isotype control, wide line = native JY, and gray-filled graph = Val-treated JY). d The expression of costimulatory CD86 molecules increased significantly (∆GMean p = 0.003) after Aza/Val treatment also assessed by flow cytometry (FUN-1 antibody)

Similar articles

Cited by

References

    1. Chen YT, Gure AO, Tsang S, Stockert E, Jager E, Knuth A, Old LJ. Identification of multiple cancer/testis antigens by allogeneic antibody screening of a melanoma cell line library. Proc Natl Acad Sci USA. 1998;95:6919–6923. doi: 10.1073/pnas.95.12.6919. - DOI - PMC - PubMed
    1. Scanlan MJ, Simpson AJ, Old LJ. The cancer/testis genes: review, standardization, and commentary. Cancer Immun. 2004;4:1. - PubMed
    1. van der Bruggen P, Traversari C, Chomez P, Lurquin C, De PE, Van den Eynde BJ, Knuth A, Boon T. A gene encoding an antigen recognized by cytolytic T lymphocytes on a human melanoma. J Immunol. 2007;178:2617–2621. - PubMed
    1. Boel P, Wildmann C, Sensi ML, Brasseur R, Renauld JC, Coulie P, Boon T, van der Bruggen P. BAGE: a new gene encoding an antigen recognized on human melanomas by cytolytic T lymphocytes. Immunity. 1995;2:167–175. doi: 10.1016/S1074-7613(95)80053-0. - DOI - PubMed
    1. Van den Eynde B, Peeters O, De BO, Gaugler B, Lucas S, Boon T. A new family of genes coding for an antigen recognized by autologous cytolytic T lymphocytes on a human melanoma. J Exp Med. 1995;182:689–698. doi: 10.1084/jem.182.3.689. - DOI - PMC - PubMed

Publication types

MeSH terms