. 2013 Oct;34(10):1914-21.
doi: 10.3174/ajnr.A3529. Epub 2013 Apr 25.

4D digital subtraction angiography: implementation and demonstration of feasibility

Affiliations

4D digital subtraction angiography: implementation and demonstration of feasibility

B Davis et al. AJNR Am J Neuroradiol. 2013 Oct.

Abstract

Background and purpose: Conventional 3D-DSA volumes are reconstructed from a series of projections containing temporal information. It was our purpose to develop a technique which would generate fully time-resolved 3D-DSA vascular volumes having better spatial and temporal resolution than that which is available with CT or MR angiography.

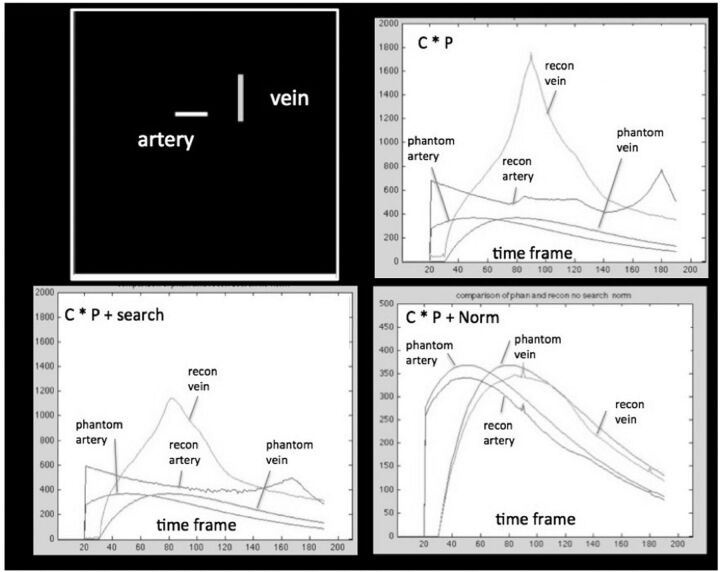
Materials and methods: After a single contrast injection, projections from the mask and fill rotation are subtracted to create a series of vascular projections. With the use of these projections, a conventional conebeam CT reconstruction is generated (conventional 3D-DSA). This is used to constrain the reconstruction of individual 3D temporal volumes, which incorporate temporal information from the acquired projections (4D-DSA).

Results: Typically, 30 temporal volumes per second are generated with the use of currently available flat detector systems, a factor of ∼200 increase over that achievable with the use of multiple gantry rotations. Dynamic displays of the reconstructed volumes are viewable from any angle. Good results have been obtained by using both intra-arterial and intravenous injections.

Conclusions: It is feasible to generate time-resolved 3D-DSA vascular volumes with the use of commercially available flat detector angiographic systems and clinically practical injection protocols. The spatial resolution and signal-to-noise ratio of the time frames are largely determined by that of the conventional 3D-DSA constraining image and not by that of the projections used to generate the 3D reconstruction. The spatial resolution and temporal resolution exceed that of CTA and MRA, and the small vessel contrast is increased relative to that of conventional 2D-DSA due to the use of maximum intensity projections.


Figures

Fig 1.
Fig 1.
Schematic of 4D-DSA reconstruction. After creation of the 4D-DSA timeframes, each one may be viewed in a dynamic form showing the inflow and outflow of contrast from the vasculature, just as with a standard 2D-DSA series. As shown on the 2 series of 4 images at the bottom of the illustration, any selected time (in this case, the image framed in red in the top row of 4 images) may be viewed at any desired angle. Four possible views of the selected image are shown in the bottom row of 4 images.
Fig 2.
Fig 2.
Images show a selected projection from a 3D-DSA rotational acquisition (top left), a 4D-DSA timeframe (center), and a standard 3D-DSA reconstruction (right). The SNRs of the 3 images at the region indicated by the yellow arrows are shown beneath each image. The single image at the bottom shows traces of the profile across the 2 arteries indicated by the red line. These images were obtained by use of an IA injection of contrast medium.
Fig 3.
Fig 3.
Demonstration of the effects of reconstruction elements on accuracy of reconstructed simulated vessel signal curves. The digital phantom is shown in the top frame on the left. The vessels in the phantom (phantom artery and phantom vein) had specified time dependence. These are considered to represent ground truth. The input time curves for these vessels are shown in each panel for comparison. C indicates constraining image; P, projections. The reconstructed wave forms are shown: 1) after multiplication (represented by C × P) of the projections by a binary constraining image (top right); 2) multiplication of the projections by the binary constraining image plus an angular minimum search (represented by C × P + search, bottom left); and 3) multiplication of the projections by the binary constraining image followed by normalization by the estimate of the numbers of projected ray voxels obtained from the constraining image (C × P + Norm, bottom right). The y-axis shows arbitrary units of attenuation. The x-axis shows the projection number.
Fig 4.
Fig 4.
Four-dimensional DSA reconstruction from a 3D-DSA reconstruction performed for evaluation of an unruptured paraclinoid aneurysm. An IA injection of contrast was used for this examination. The top row shows selected timeframes viewed at the rate of 6 frames per second at a fixed viewing angle. The bottom row shows the same timeframes viewed at 4 different angles, which would have not been obtainable in a biplane acquisition because of the mechanical inability to position the A-plane gantry (red icon).
Fig 5.
Fig 5.
Comparison of intravenous 3D-DSA and early arterial phase time from a 4D-DSA reconstruction. In the standard 3D-DSA on the left, the overlap of both arteries and veins obscures visualization of the internal carotid arteries. In this example, there is no viewing angle that will eliminate this overlap in the 3D-DSA. The image on the right is an early arterial timeframe from a 4D-DSA reconstruction viewed from the same angle as the 3D-DSA on the left. In this 4D image, the full course the right internal carotid artery is clearly visualized (red arrows). The red ellipse shows the position of the distal segments of the internal carotid arteries in both images.
Fig 6.
Fig 6.
Color-coded 4D-DSA and bolus arrival images. The sequence was displayed at a rate of 6 frames per second for visualization of arrival times between 1 and 4.5 seconds. On the top of the figure, binarized 4D-DSA timeframes multiply a time-of-arrival map providing a dynamic display in which each pixel in each timeframe is represented by a quantitative time of arrival value. In the bottom half of the figure, a sliding Gaussian display window is used to show the passage of the bolus through the AVM. The 4D-DSA TOA volume (static) and 4D-DSA TOA (dynamic) 3D timeframes can be viewed from any angle. The 4D-DSA TOA (dynamic) 3D timeframes allow viewing of the temporal dynamics of the 4D-DSA TOA from any angle at any point in time for which data were acquired. These images were obtained by use of an IA injection of contrast medium.
Fig 7.
Fig 7.
Relative spatial and temporal resolution for competing time-resolved angiography methods. The MRA values are based on the hybrid MRA method reported by Wu et al and provide 0.69-mm pixel dimensions, leading to a voxel volume of 0.33 mm3. Typical frame times are 0.3 seconds. The CTA estimate is based on the large area Aquilion system (Toshiba Medical Systems, Tokya, Japan) with a pixel dimension of 0.625 and frame rate of approximately 3/s. The 4D-DSA ultimate spatial resolution assuming a magnification factor of 1.5 and a pixel dimension 100 should easily support 200-μ pixel dimensions in a patient, leading to a voxel volume of 0.008 mm3.

Comment in

References

    1. Mistretta CA, Kruger RA, Houk TL, et al. . Computerized fluoroscopy techniques for noninvasive cardiovascular imaging: SPIE. Appl Opt Instr Med 1978;152:65–71
    1. Kruger RA, Mistretta CA, Houk TL, et al. . Computerized fluoroscopy in real time for noninvasive visualization of the cardiovascular system: preliminary studies. Radiology 1979;130:49–57 - PubMed
    1. Strother CM, Sackett JF, Crummy AB, et al. . Clinical applications of computerized fluoroscopy: the extracranial carotid arteries. Radiology 1980;136:781–83 - PubMed
    1. Ning R, Kruger RA. Computer simulation of image intensifier-based computed tomography detector: vascular application. Med Phys 1988;15:188–92 - PubMed
    1. Ning R, Kruger RA. Image intensifier-based computed tomography volume scanner for angiography. Acad Radiol 1996;3:344–50 - PubMed

Publication types

MeSH terms