

RNAlyzer--novel approach for quality analysis of RNA structural models
- PMID: 23620294
- PMCID: PMC3695499
- DOI: 10.1093/nar/gkt318
RNAlyzer--novel approach for quality analysis of RNA structural models
Abstract
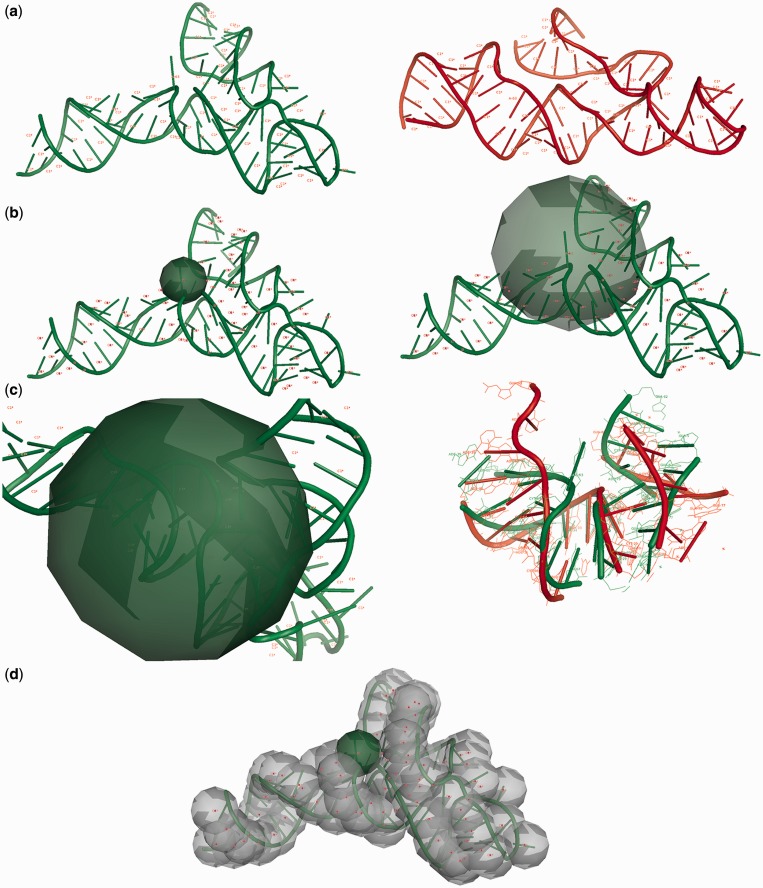
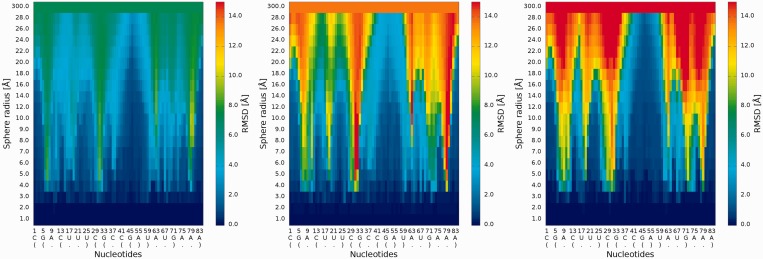
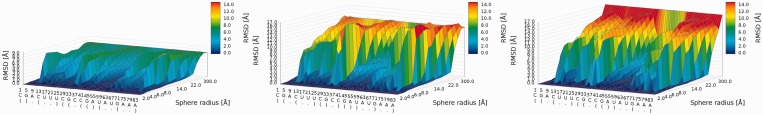
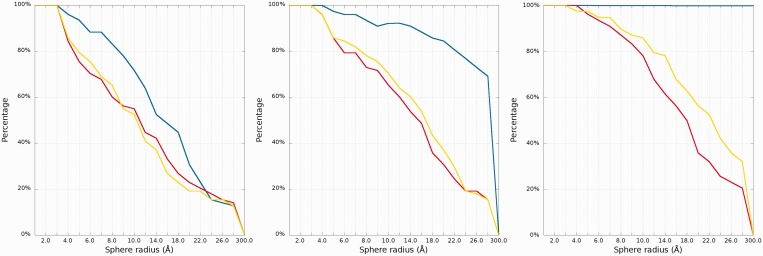
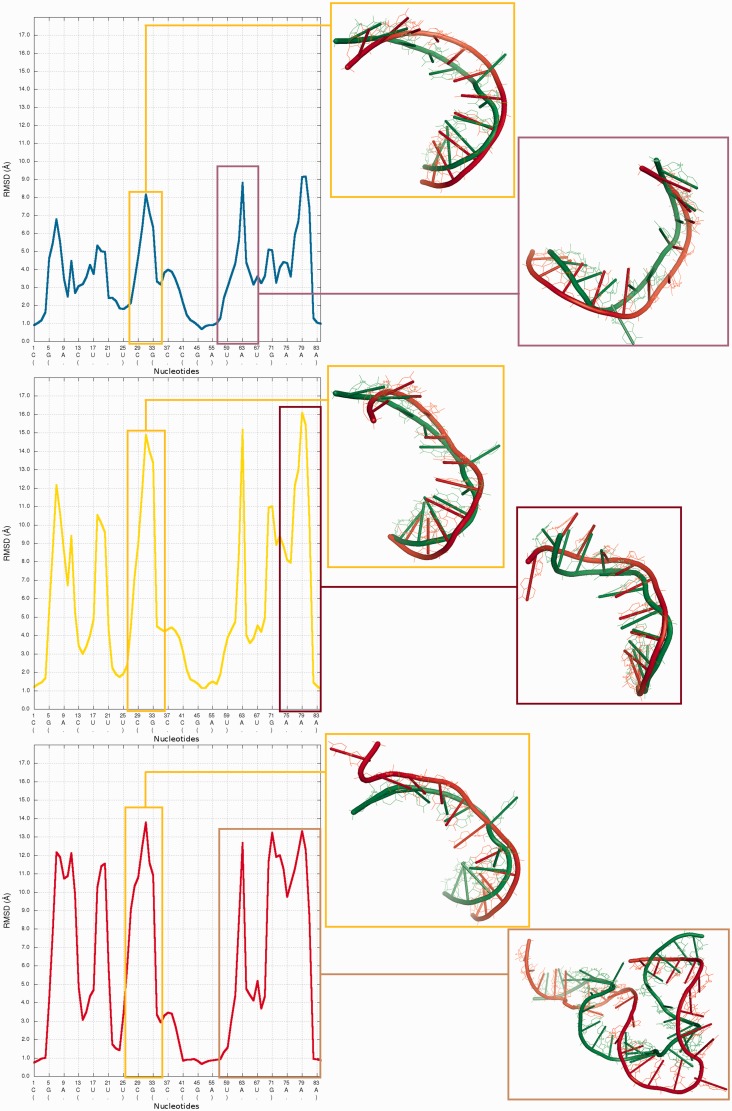
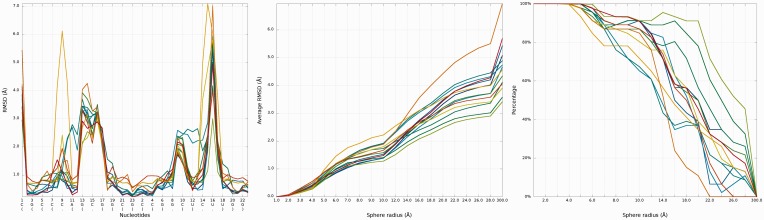
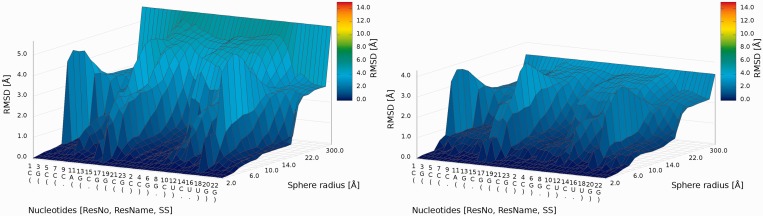
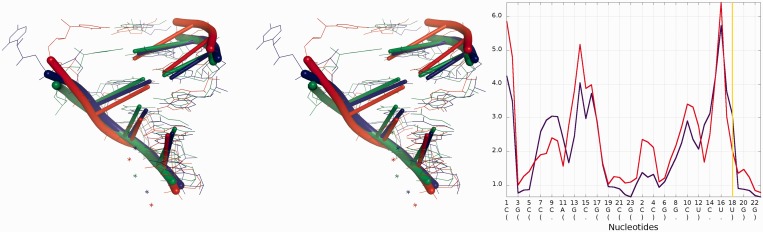
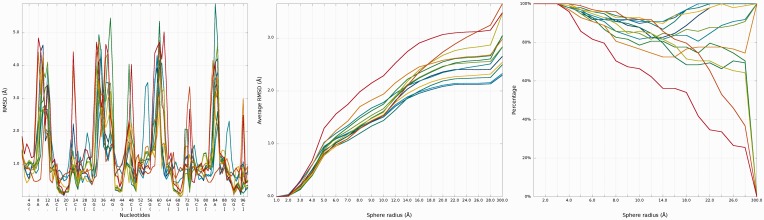
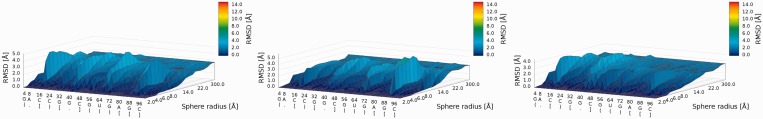
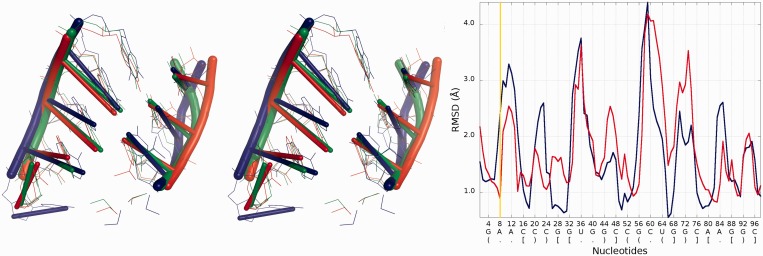
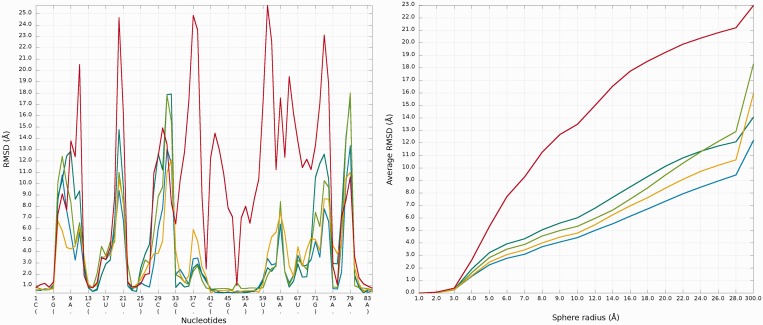
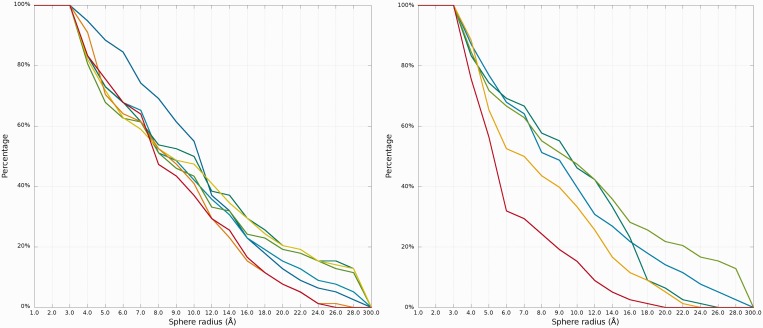
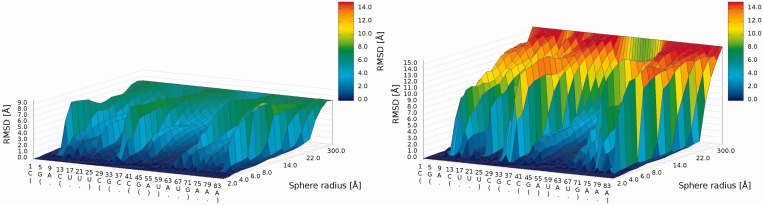
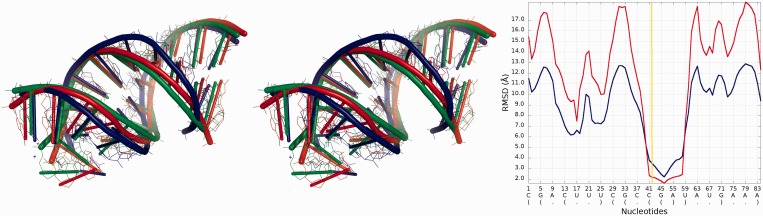
The continuously increasing amount of RNA sequence and experimentally determined 3D structure data drives the development of computational methods supporting exploration of these data. Contemporary functional analysis of RNA molecules, such as ribozymes or riboswitches, covers various issues, among which tertiary structure modeling becomes more and more important. A growing number of tools to model and predict RNA structure calls for an evaluation of these tools and the quality of outcomes their produce. Thus, the development of reliable methods designed to meet this need is relevant in the context of RNA tertiary structure analysis and can highly influence the quality and usefulness of RNA tertiary structure prediction in the nearest future. Here, we present RNAlyzer-a computational method for comparison of RNA 3D models with the reference structure and for discrimination between the correct and incorrect models. Our approach is based on the idea of local neighborhood, defined as a set of atoms included in the sphere centered around a user-defined atom. A unique feature of the RNAlyzer is the simultaneous visualization of the model-reference structure distance at different levels of detail, from the individual residues to the entire molecules.
Figures
Similar articles
-
RNAssess--a web server for quality assessment of RNA 3D structures.Nucleic Acids Res. 2015 Jul 1;43(W1):W502-6. doi: 10.1093/nar/gkv557. Epub 2015 Jun 11. Nucleic Acids Res. 2015. PMID: 26068469 Free PMC article.
-
RNA 3D Structure Modeling by Combination of Template-Based Method ModeRNA, Template-Free Folding with SimRNA, and Refinement with QRNAS.Methods Mol Biol. 2016;1490:217-35. doi: 10.1007/978-1-4939-6433-8_14. Methods Mol Biol. 2016. PMID: 27665602
-
RNAmap2D - calculation, visualization and analysis of contact and distance maps for RNA and protein-RNA complex structures.BMC Bioinformatics. 2012 Dec 21;13:333. doi: 10.1186/1471-2105-13-333. BMC Bioinformatics. 2012. PMID: 23259794 Free PMC article.
-
Shedding light on the dark matter of the biomolecular structural universe: Progress in RNA 3D structure prediction.Methods. 2019 Jun 1;162-163:68-73. doi: 10.1016/j.ymeth.2019.04.012. Epub 2019 Apr 24. Methods. 2019. PMID: 31028927 Review.
-
Computational methods for prediction of RNA interactions with metal ions and small organic ligands.Methods Enzymol. 2015;553:261-85. doi: 10.1016/bs.mie.2014.10.057. Epub 2015 Feb 3. Methods Enzymol. 2015. PMID: 25726469 Review.
Cited by
-
The use of interatomic contact areas to quantify discrepancies between RNA 3D models and reference structures.Nucleic Acids Res. 2014 May;42(9):5407-15. doi: 10.1093/nar/gku191. Epub 2014 Mar 12. Nucleic Acids Res. 2014. PMID: 24623815 Free PMC article.
-
Genetic and pharmacological strategies to refunctionalize the von Hippel Lindau R167Q mutant protein.Cancer Res. 2014 Jun 1;74(11):3127-36. doi: 10.1158/0008-5472.CAN-13-3213. Epub 2014 Apr 22. Cancer Res. 2014. PMID: 24755468 Free PMC article.
-
RNAfitme: a webserver for modeling nucleobase and nucleoside residue conformation in fixed-backbone RNA structures.BMC Bioinformatics. 2018 Aug 22;19(1):304. doi: 10.1186/s12859-018-2317-9. BMC Bioinformatics. 2018. PMID: 30134831 Free PMC article.
-
Unknotting RNA: A method to resolve computational artifacts.PLoS Comput Biol. 2025 Mar 20;21(3):e1012843. doi: 10.1371/journal.pcbi.1012843. eCollection 2025 Mar. PLoS Comput Biol. 2025. PMID: 40112280 Free PMC article.
-
RNApdbee--a webserver to derive secondary structures from pdb files of knotted and unknotted RNAs.Nucleic Acids Res. 2014 Jul;42(Web Server issue):W368-72. doi: 10.1093/nar/gku330. Epub 2014 Apr 25. Nucleic Acids Res. 2014. PMID: 24771339 Free PMC article.
References
-
- Gesteland RF, Cech TR, Atkins JF. The RNA World. Cold Spring Harbor, New York, NY: Cold Spring Harbor Laboratory Press; 2006.
Publication types
MeSH terms
Substances
LinkOut - more resources
Full Text Sources
Other Literature Sources
