. 2013 Jun 14;288(24):17631-42.
doi: 10.1074/jbc.M113.468819. Epub 2013 Apr 25.

Insulin-like growth factor I (IGF-I)-induced chronic gliosis and retinal stress lead to neurodegeneration in a mouse model of retinopathy

Affiliations

Insulin-like growth factor I (IGF-I)-induced chronic gliosis and retinal stress lead to neurodegeneration in a mouse model of retinopathy

Pilar Villacampa et al. J Biol Chem. .

Abstract

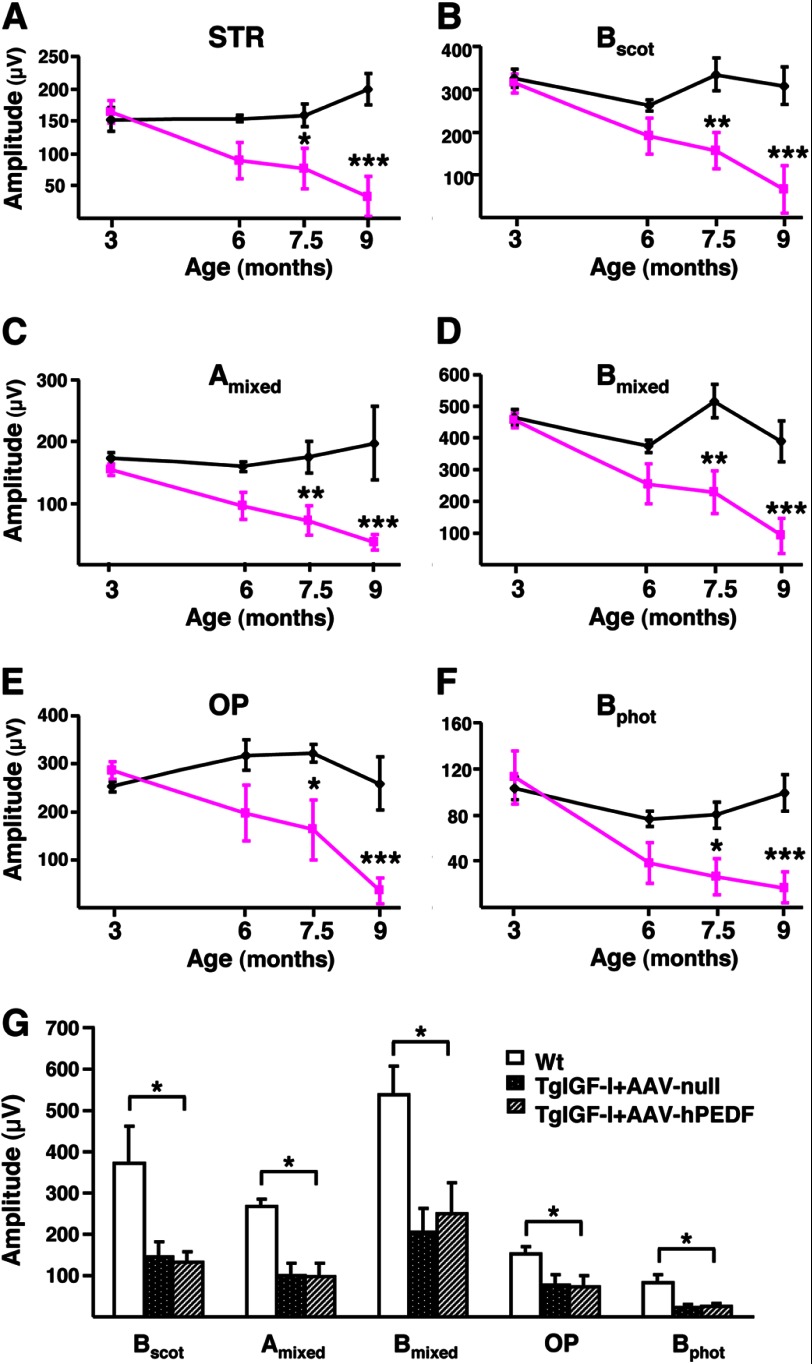
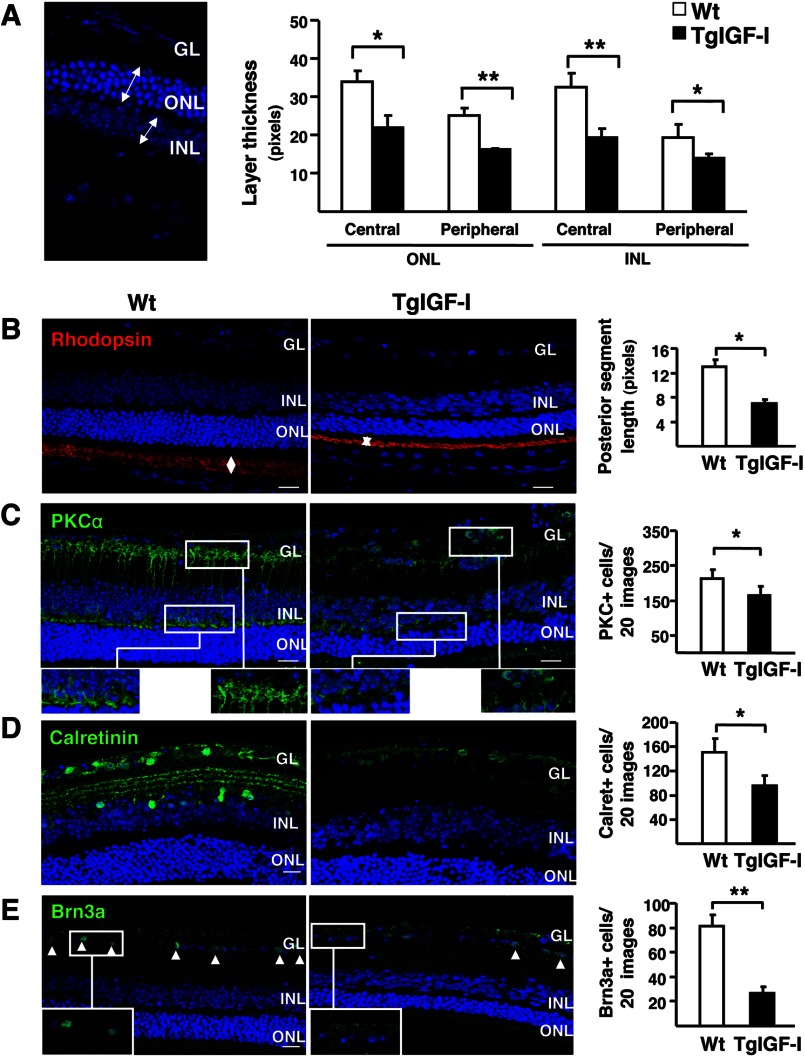
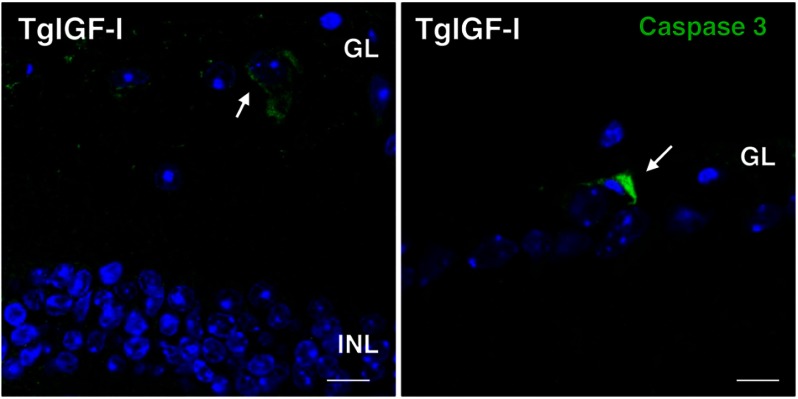
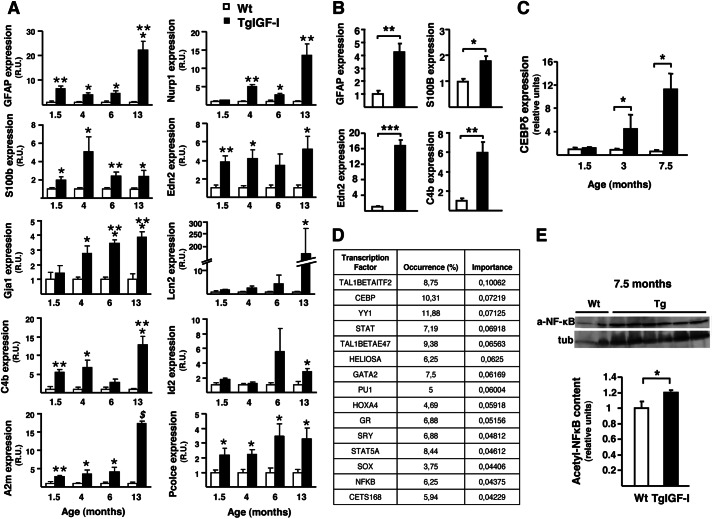
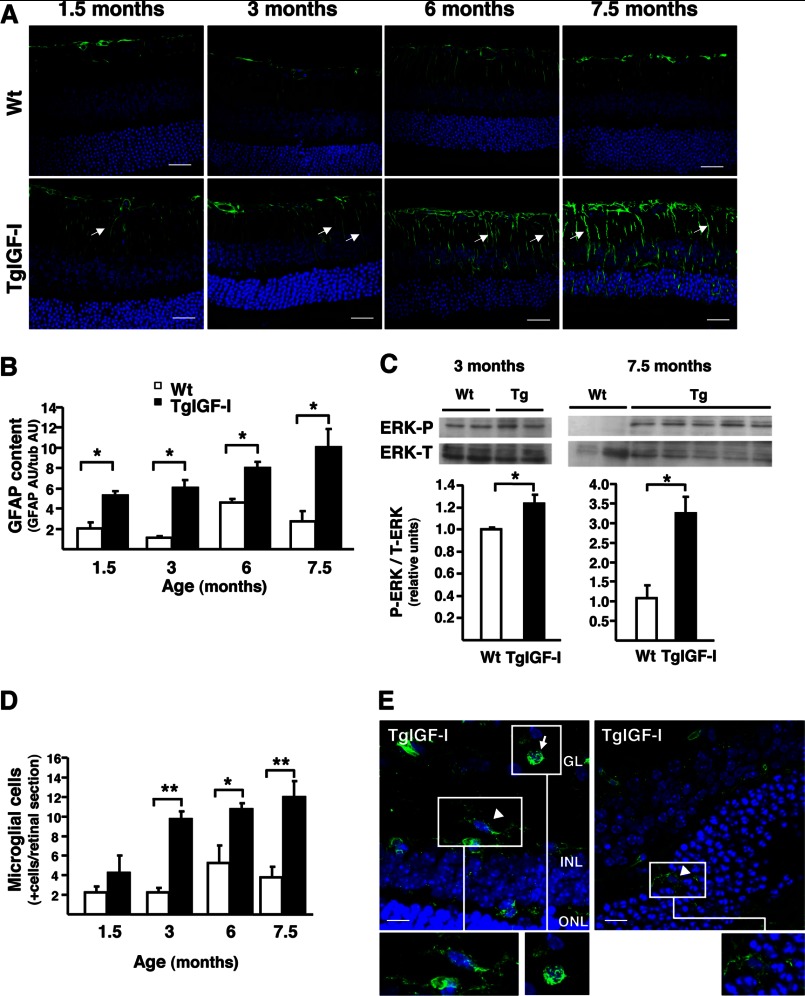
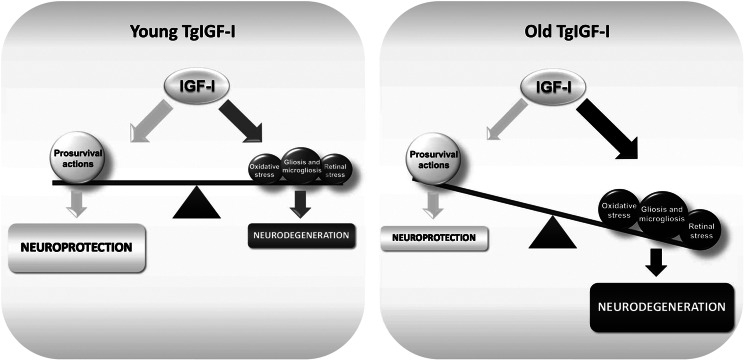
Insulin-like growth factor I (IGF-I) exerts multiple effects on different retinal cell types in both physiological and pathological conditions. Despite the growth factor's extensively described neuroprotective actions, transgenic mice with increased intraocular levels of IGF-I showed progressive impairment of electroretinographic amplitudes up to complete loss of response, with loss of photoreceptors and bipolar, ganglion, and amacrine neurons. Neurodegeneration was preceded by the overexpression of genes related to retinal stress, acute-phase response, and gliosis, suggesting that IGF-I altered normal retinal homeostasis. Indeed, gliosis and microgliosis were present from an early age in transgenic mice, before other alterations occurred, and were accompanied by signs of oxidative stress and impaired glutamate recycling. Older mice also showed overproduction of pro-inflammatory cytokines. Our results suggest that, when chronically increased, intraocular IGF-I is responsible for the induction of deleterious cellular processes that can lead to neurodegeneration, and they highlight the importance that this growth factor may have in the pathogenesis of conditions such as ischemic or diabetic retinopathy.

Keywords: Animal Models; Glia; Insulin-like Growth Factor (IGF); Neurodegeneration; Retina.


Figures

FIGURE 1.
FIGURE 1.
Progressive alteration of electroretinographic responses in transgenic mice with increased intraocular IGF-I. A–F, evolution over time of ERG responses in TgIGF-I mice (pink lines) compared with healthy littermates (black lines). With age, TgIGF-I showed a progressive decline in the recorded amplitudes in response to all stimuli tested. A, scotopic threshold response, representing highly sensitive responses of rod photoreceptors; B, scotopic b-wave, representing rod responses; C, mixed scotopic, reflecting stimulation of both rod and cones under scotopic conditions; D, oscillatory potentials, which measure INL neuronal activity; E, photopic b-wave, depicting cone responses; F, flicker, repetitive photopic stimulations that analyze cone recovery. There were statistically significant reductions in the responses in animals aged more than 7.5 months. G, ERG responses were recorded 6 months after a single intravitreal administration of AAV2-hPEDF (left eye) and AAV2-null (right eye) vectors to TgIGF-I mice aged 1.5 months. Age-matched WT littermates were used as controls. Scotopic b-wave (Bscot), mixed a and b-waves, oscillatory potentials, and photopic b-wave (Bphot) were analyzed. Despite the counteraction of retinal neovascularization, the overexpression of PEDF was not able to ameliorate the electroretinographic responses of treated eyes, which presented reduced amplitudes in all tests performed, similar to those of null-injected, untreated eyes. Values are expressed as the mean ± S.E. of 5–9 animals/group. *, p <0.05; **, p <0.01; ***, p <0.001.
FIGURE 2.
FIGURE 2.
Reduced thickness of the different retinal layers and decreased neuronal populations in IGF-I-overexpressing retinas. A, thickness of retinal layers was measured at 7.5 months of age. Retinal layers were clearly thinner in TgIGF-I mice, with statistically significant reductions in both ONL and INL thickness in central and peripheral retina. B–E, representative images of the immunolabeling of retinal sections with specific neuronal markers (left) and quantification of labeled populations (right) in 7.5-month-old WT and TgIGF-I mice. B, rhodopsin immunolabeling (red) showing positive staining in the outer segment (OS) of photoreceptors. Outer segment length (arrows) was measured in medial retinal sections. The length of the outer segment was significantly reduced in transgenic retinas. C, representative images of PKCα immunostaining (green). The terminals of bipolar cells located in the outer and inner plexiform layers (upper and lower insets) were strongly positive in WT retinas. Cell bodies spanning from the INL to the GL were also labeled. Transgenic retinas showed reduced PKCα reactivity. Quantification of the number INL PKC-positive cells revealed a significant loss of bipolar PKC+ cells in transgenic mice. D, representative images of calretinin immunolabeling (green) showing reduced staining in both the GL and the INL in TgIGF-I. Quantification of the number of calretinin+ cells demonstrated a reduction in the number of amacrine neurons in transgenic retinas. E, immunofluorescent detection of Brn3a (green), expressed specifically in the nuclei of ganglion neurons (arrowheads). Transgenic retinas showed fewer Brn3a positive nuclei in the GL. Nuclei were counterstained with DAPI (blue). Values are expressed as the mean ± S.E. of 5–9 animals/group. *, p <0.05; **, p <0.01. Scale bar, (A) 35.51 μm; B–E, 18.37 μm.
FIGURE 3.
FIGURE 3.
Detection of apoptotic cells in the retinas of transgenic mice with increased intraocular IGF-I. Cells positive for the apoptosis marker cleaved caspase 3 (green, arrows) were found in the ganglion cell layer of transgenic retinas at 6 months of age. Cleaved caspase 3-positive cells could not be detected in retinal sections from age-matched wild-type animals. Nuclei were stained with DAPI (blue). Scale bar, 7.6 μm (left panel), and 11.43 μm (right panel).
FIGURE 4.
FIGURE 4.
Retinal gene expression profile in young TgIGF-I mice. A, analysis of the expression of gliosis, retinal stress, and acute-phase-related genes in WT and transgenic retinas at different ages. Values are expressed as mean ± S.E. of three animals/group. *, p <0.05; **, p <0.01; ***, p <0.001, $, p <0.0001. B, Gfap, S100B, Edn2, and C4b were already up-regulated in 3-week-old transgenic retinas when analyzed by quantitative PCR. Values are expressed as mean ± S.E. of four animals/group. *, p <0.05; **, p <0.01; ***, p <0.001. C, quantitative RT-PCR analysis of the expression of the transcription factor CEBP-δ in WT and transgenic retinas at the indicated ages. Statistically significant increases in the expression of CEBP-δ were observed in transgenic retinas at 3 and 7.5 months of age. Values are expressed as the mean ± S.E. of 4–5 animals/group.*, p <0.05. D, functional analysis of significant enrichment in the target sequences for a specific set of transcription factors in the genes with altered expression in the microarray using the GeneCodis software. The table shows the percentage of altered genes whose promoters contained target sequences for the indicated transcription factors. E, retinal content of the acetylated, nuclear form of NF-κB (a-NF-κB) at 7.5 months of age. tub, tubulin. Transgenic mice presented higher levels of acetyl-NF-κB when compared with age-matched WT retinas, indicating activation of this pathway. Values are expressed as mean ± S.E. of 2–6 animals/group. *, p <0.05.
FIGURE 5.
FIGURE 5.
Progression of gliosis and microgliosis in TgIGF-I retinas. A, GFAP immunofluorescent detection (green) in retinal sections from WT and TgIGF-I mice at different ages. At all ages analyzed, transgenic retinas showed overexpression of GFAP, especially in radial Müller cells processes spanning the entire retina (arrows), where GFAP is hardly expressed. This pattern of GFAP staining indicated the presence of reactive gliosis in transgenic retinas. Nuclei were stained with DAPI (blue). Scale bar, 31.27 μm. B, GFAP content was analyzed by Western blot in retinal extracts from WT and TgIGF-I mice at the indicated ages. Quantification of blots demonstrated that GFAP levels were increased in transgenic retinas at all ages. AU, arbitrary units. Values are expressed as mean ± S.E. of two animals/group. *, p <0.05. C, ERK phosphorylation was analyzed by Western blot in retinal extracts from WT and TgIGF-I mice at 3 and 7.5 months of age. After normalization by total ERK levels, quantification of blots showed that P-ERK levels were increased in transgenic retinas at both ages. Values are expressed as mean ± S.E. of four animals/group. *, p <0.05. D, immunofluorescent detection with tomato lectin (Lycopersicum esculentum) allowed the identification of microglial cells in retinal sections. The number of lectin-positive cells per section was determined in retinal sections from WT and transgenic retinas at different ages, showing statistically significant differences in retinas of mice aged 3 months and older. Values are expressed as mean ± S.E. of four animals/group. *, p <0.05; **, p <0.01. E, representative images obtained from transgenic retinas at 7.5 months of age. Arrow indicates a round-shaped lectin+ cell, likely an activated microglial cell, and arrowheads indicate a microglial cell with characteristic stellar shape and dendriform ramifications. Scale bar, 12.06 μm (left panel), 8.54 (right panel).
FIGURE 6.
FIGURE 6.
Increased gliosis in wild-type retinas exposed to recombinant IGF-I. A, GFAP; B, S100b expression levels in WT retinas incubated with increasing concentrations of IGF-I in the presence or absence of wortmannin, an inhibitor of IGF-I downstream signaling. The expression of both markers of gliosis was increased in the presence of IGF-I, and this effect was abrogated by the addition of wortmannin. Values are expressed as the mean ± S.E. of 3–4 retinas/group. *, p <0.05.
FIGURE 7.
FIGURE 7.
Increased oxidative stress in mice with increased intraocular IGF-I. Analysis of markers of oxidative stress in WT and Tg-IGF-I animals at different ages. A, levels of oxidized glutathione were higher in transgenic retinas at all ages studied. Values are expressed as the mean ± S.E. of five animals/group. *, p <0.05. B, up-regulation of Nrf2 expression in both young and old transgenic retinas, determined by quantitative PCR. Values are expressed as the mean ± S.E. of 4–5 animals/group. *, p <0.05. Retinal expression of the p67Phox (C) and p22Phox (D) regulatory subunits of the NADPH oxidase enzyme, assessed by quantitative RT-PCR. A marked up-regulation of both subunits was observed in transgenic mice at 3 and 7.5 months of age. E–G, retinal expression of the catalytic subunit of NADPH oxidase, which are expressed in different retinal cell types. E, Nox1; F, Nox2, and G, Nox4 were all markedly up-regulated in transgenic retinas at 7.5 months of age. nd, not detected. Values are expressed as mean ± S.E. of 4–5 animals/group. *, p <0.05. H, retinal expression by quantitative RT-PCR of the enzyme iNOS. There was a marked increase in iNOS expression in transgenic retinas at 7.5 months of age. Values are expressed as mean ± S.E. of 4–5 animals/group. *, p <0.05.
FIGURE 8.
FIGURE 8.
Impaired retinal glial functionality in mice with increased intraocular IGF-I. A, retinal GS activity was assayed in WT and TgIGF-I mice by spectrophotometric monitoring of γ-glutamyl hydroxamate. GS activity was significantly reduced in transgenic animals from an early age. Values are expressed as mean ± S.E. of 8–13 animals/group. *, p <0.05. B, follow up of retinal TNF-α expression by quantitative PCR. TNF-α was noticeably increased in TgIGF-I at 7.5 months of age. Values are expressed as mean ± S.E. of 4–5 animals/group. *, p <0.05. C, retinal MCP-1 content in 7.5 month-old WT and TgIGF-I mice analyzed by Western blot. MCP-1 levels were significantly higher in transgenic retinas. Values are expressed as mean ± S.E. of four animals/group. **, p <0.01. tub, tubulin.
FIGURE 9.
FIGURE 9.
Schematic representation summarizing IGF-I actions on IGF-I transgenic retinas. IGF-I has well described prosurvival properties that are essential for normal neuronal functionality and protection. However, excess IGF-I stimulation induces deleterious processes (gliosis and microgliosis, retinal and oxidative stress) that contribute to the impairment of neuronal functionality and viability, leading to neurodegeneration. IGF-I pro-survival actions are unable to counteract neurodegeneration as animals age.

Similar articles

Cited by

References

    1. Laviola L., Natalicchio A., Giorgino F. (2007) The IGF-I signaling pathway. Curr. Pharm. Des. 13, 663–669 - PubMed
    1. Shaw L. C., Grant M. B. (2004) Insulin-like growth factor-1 and insulin-like growth factor binding proteins: their possible roles in both maintaining normal retinal vascular function and in promoting retinal pathology. Rev. Endocr. Metab. Disord. 5, 199–207 - PubMed
    1. Inokuchi N., Ikeda T., Imamura Y., Sotozono C., Kinoshita S., Uchihori Y., Nakamura K. (2001) Vitreous levels of insulin-like growth factor-I in patients with proliferative diabetic retinopathy. Curr. Eye Res. 23, 368–371 - PubMed
    1. Smith L. E., Shen W., Perruzzi C., Soker S., Kinose F., Xu X., Robinson G., Driver S., Bischoff J., Zhang B., Schaeffer J. M., Senger D. R. (1999) Regulation of vascular endothelial growth factor-dependent retinal neovascularization by insulin-like growth factor-1 receptor. Nat. Med. 5, 1390–1395 - PubMed
    1. Kondo T., Vicent D., Suzuma K., Yanagisawa M., King G. L., Holzenberger M., Kahn C. R. (2003) Knockout of insulin and IGF-1 receptors on vascular endothelial cells protects against retinal neovascularization. J. Clin. Invest. 111, 1835–1842 - PMC - PubMed

Publication types

MeSH terms