

Discrimination of gastrointestinal nematode eggs from crude fecal egg preparations by inhibitor-resistant conventional and real-time PCR
- PMID: 23620739
- PMCID: PMC3631180
- DOI: 10.1371/journal.pone.0061285
Discrimination of gastrointestinal nematode eggs from crude fecal egg preparations by inhibitor-resistant conventional and real-time PCR
Abstract
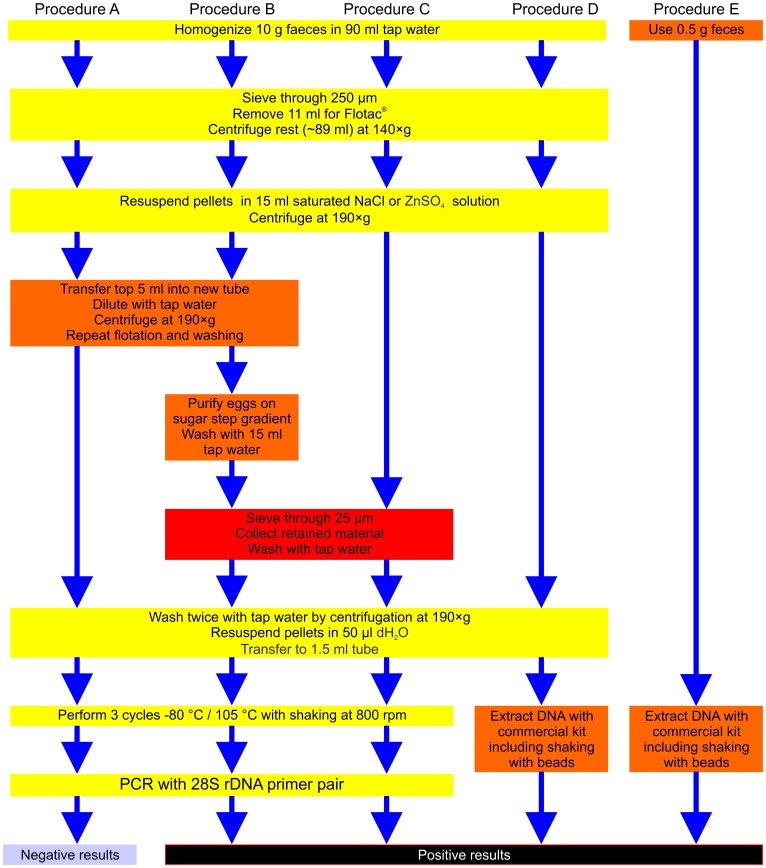
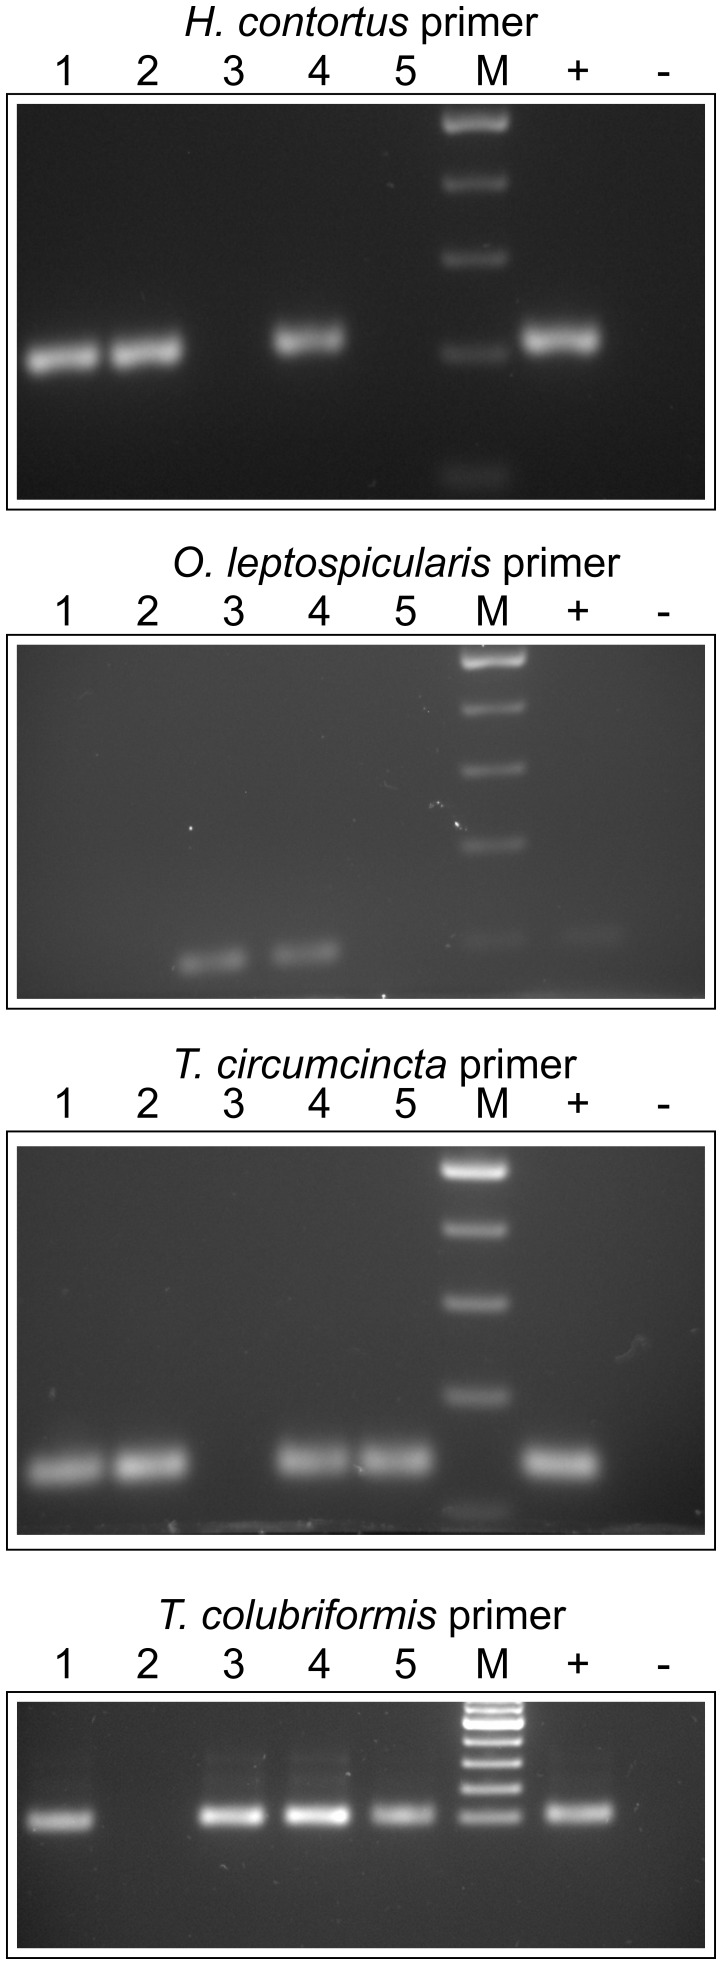
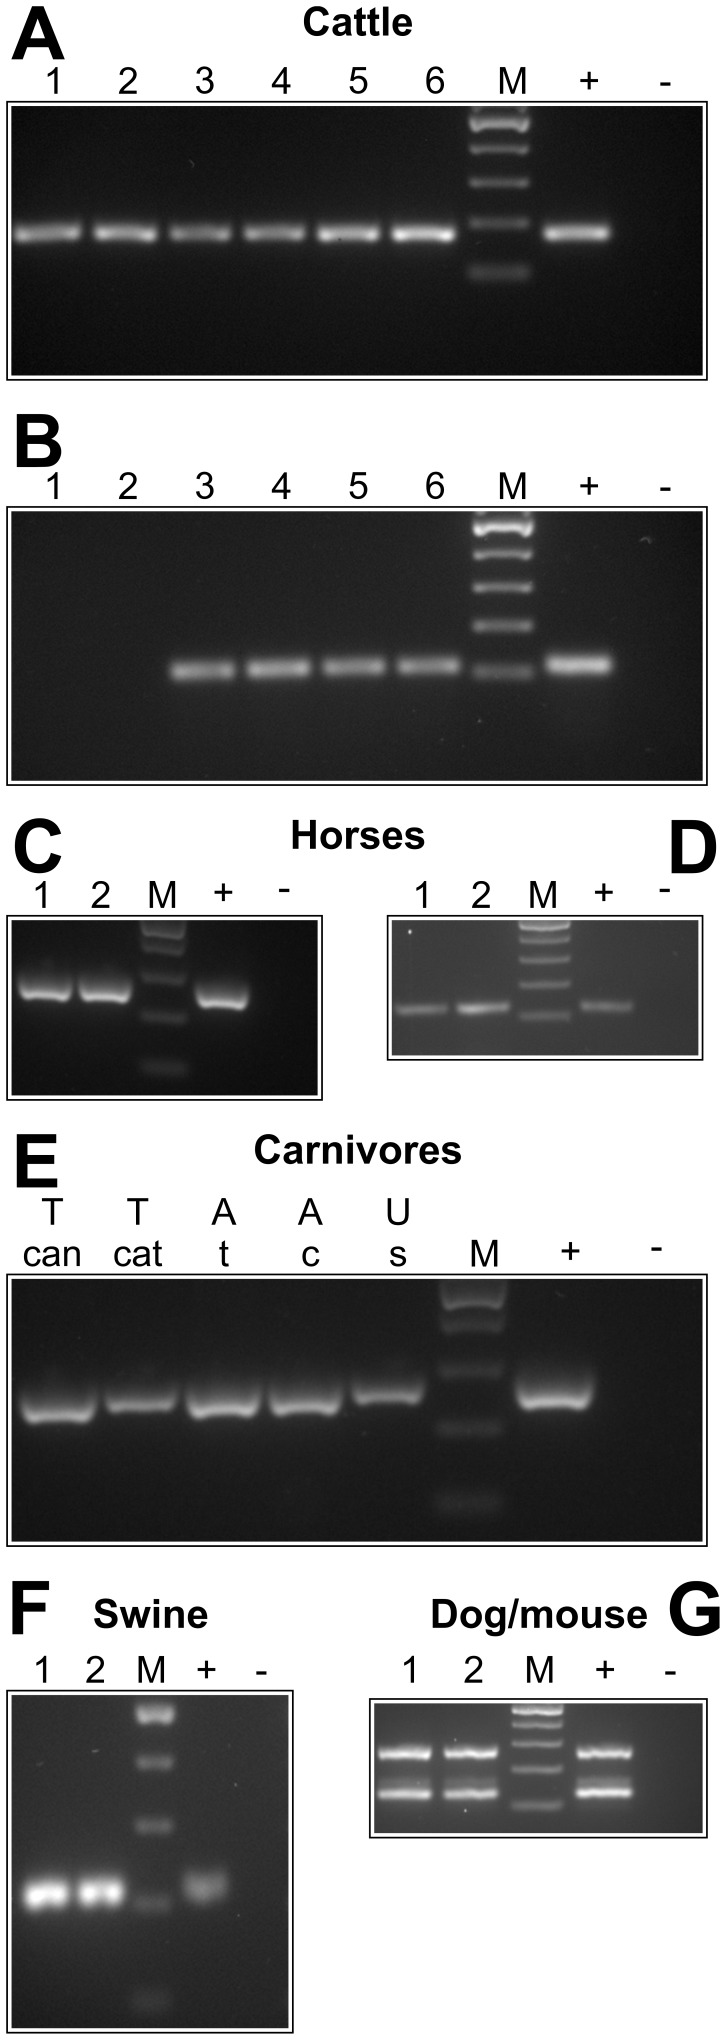
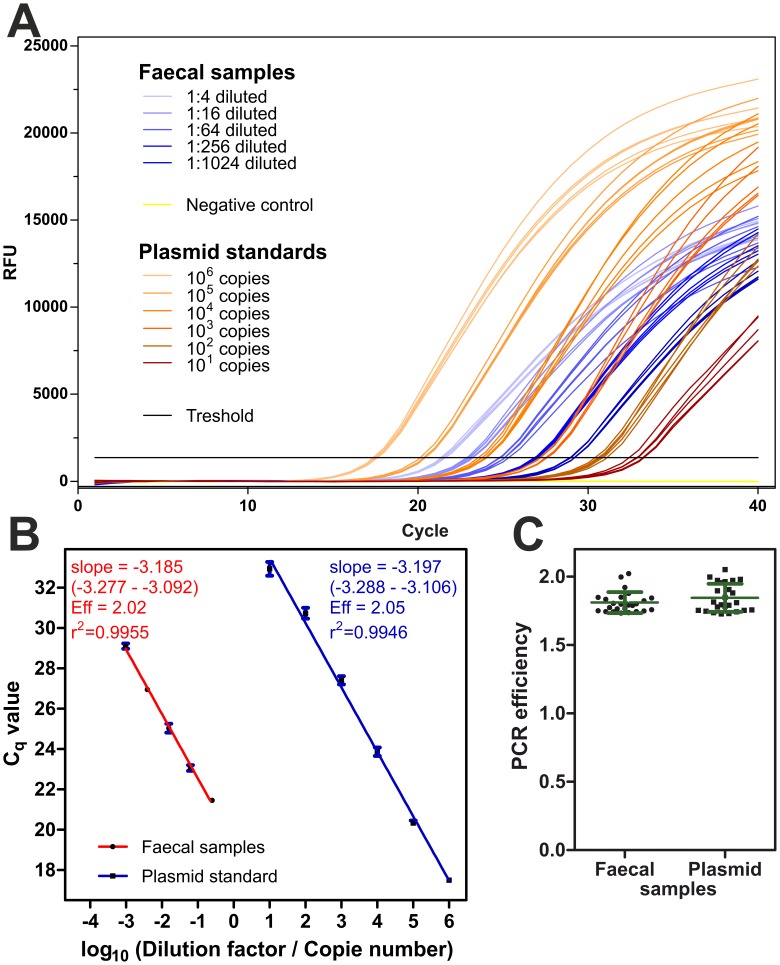
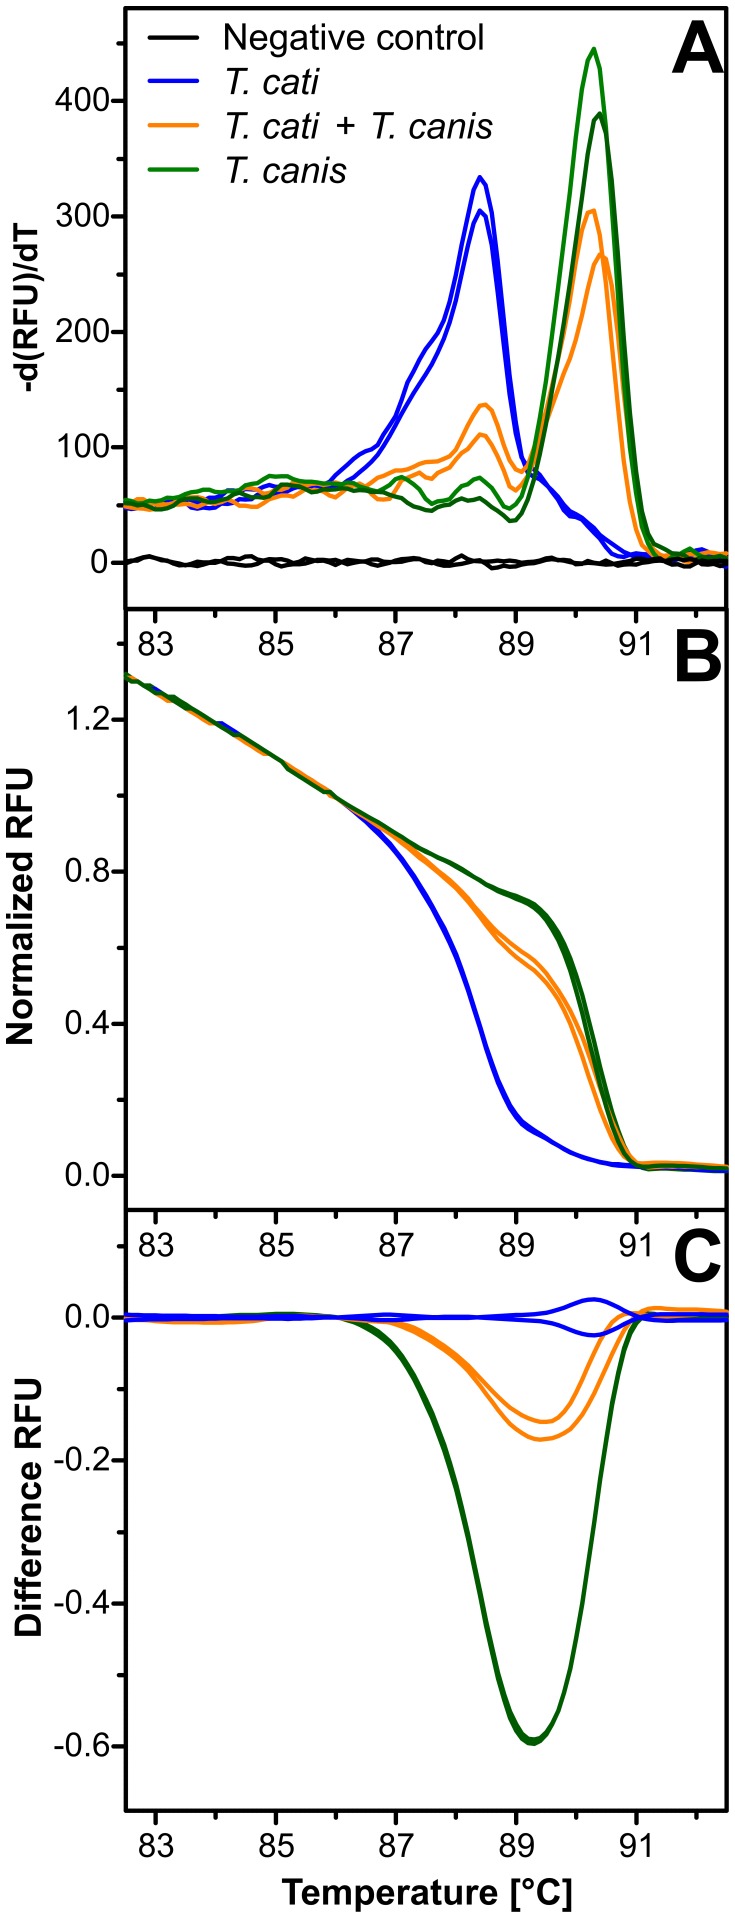
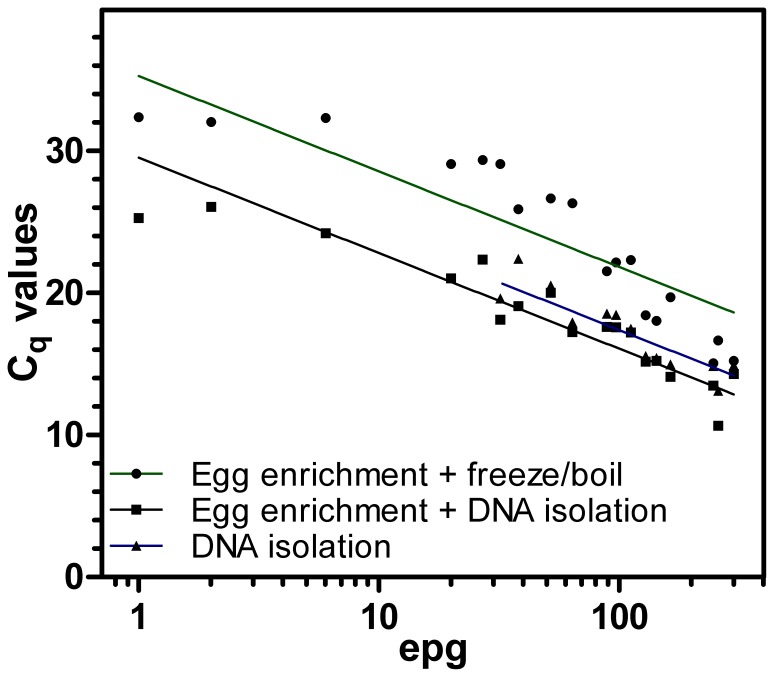
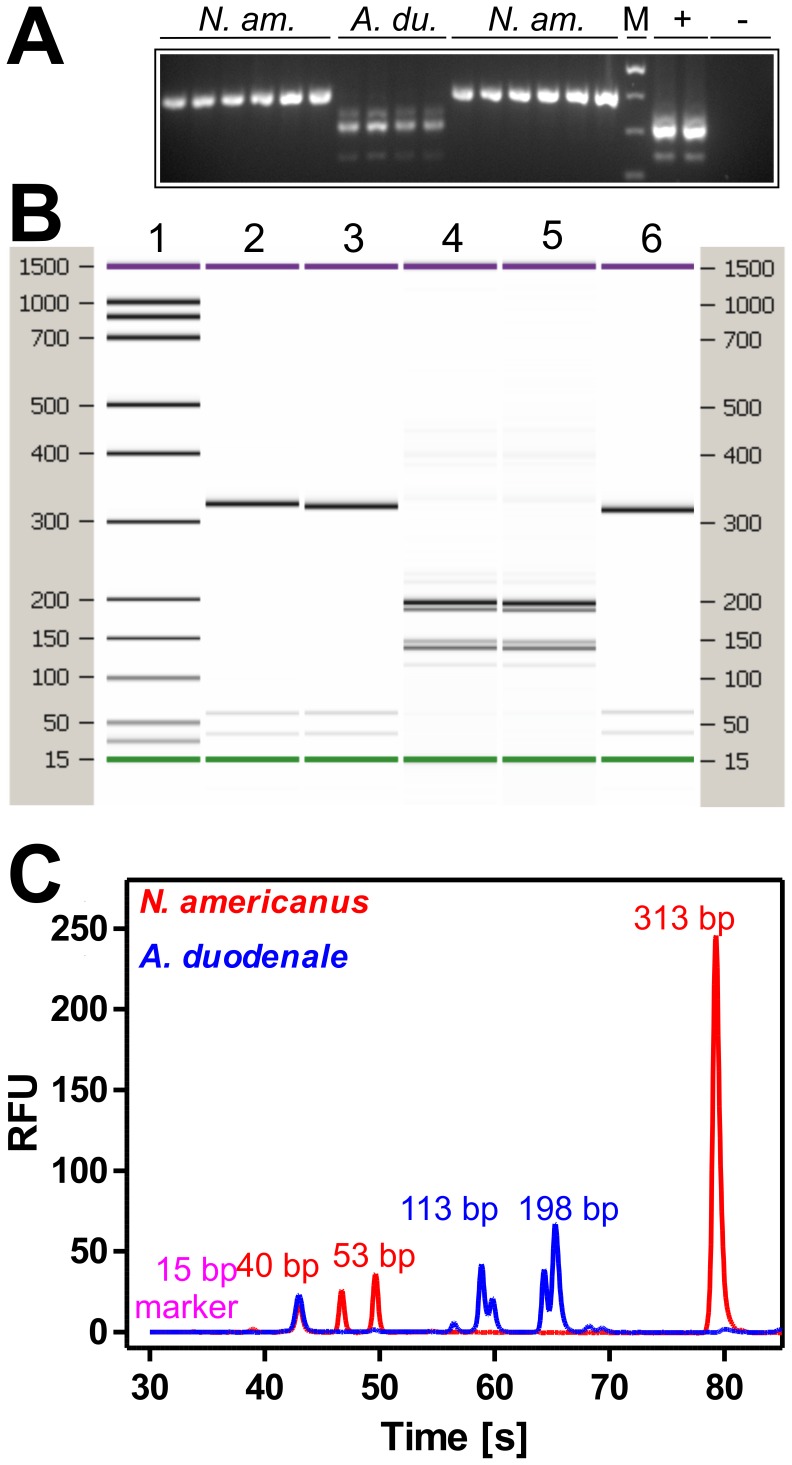
Diagnosis of gastrointestinal nematodes relies predominantly on coproscopic methods such as flotation, Kato-Katz, McMaster or FLOTAC. Although FLOTAC allows accurate quantification, many nematode eggs can only be differentiated to genus or family level. Several molecular diagnostic tools discriminating closely related species suffer from high costs for DNA isolation from feces and limited sensitivity since most kits use only small amounts of feces (<1 g). A direct PCR from crude egg preparations was designed for full compatibility with FLOTAC to accurately quantify eggs per gram feces (epg) and determine species composition. Eggs were recovered from the flotation solution and concentrated by sieving. Lysis was achieved by repeated boiling and freezing cycles - only Trichuris eggs required additional mechanic disruption. Egg lysates were directly used as template for PCR with Phusion DNA polymerase which is particularly resistant to PCR inhibitors. Qualitative results were obtained with feces of goats, cattle, horses, swine, cats, dogs and mice. The finally established protocol was also compatible with quantitative real-time PCR in the presence of EvaGreen and no PCR inhibition was detectable when extracts were diluted at least fourfold. Sensitivity was comparable to DNA isolation protocols and spiked samples with five epg were reliably detected. For Toxocara cati a detection limit below one epg was demonstrated. It was possible to distinguish T. cati and Toxocara canis using high resolution melt (HRM) analysis, a rapid tool for species identification. In human samples, restriction fragment length polymorphism (RFLP) and HRM analysis were used to discriminate Necator americanus and Ancylostoma duodenale. The method is able to significantly improve molecular diagnosis of gastrointestinal nematodes by increasing speed and sensitivity while decreasing overall costs. For identification of species or resistance alleles, analysis of PCR products with many different post PCR methods can be used such as RFLP, reverse-line-blot, Sanger sequencing and HRM.
Conflict of interest statement
Figures
Similar articles
-
Duplex quantitative real-time PCR assay for the detection and discrimination of the eggs of Toxocara canis and Toxocara cati (Nematoda, Ascaridoidea) in soil and fecal samples.Parasit Vectors. 2012 Dec 7;5:288. doi: 10.1186/1756-3305-5-288. Parasit Vectors. 2012. PMID: 23216873 Free PMC article.
-
Cattle gastrointestinal nematode egg-spiked faecal samples: high recovery rates using the Mini-FLOTAC technique.Parasit Vectors. 2020 May 6;13(1):230. doi: 10.1186/s13071-020-04107-0. Parasit Vectors. 2020. PMID: 32375871 Free PMC article.
-
Experimental estimation of the efficacy of the FLOTAC basic technique.J Parasitol. 2014 Oct;100(5):633-9. doi: 10.1645/13-333.1. Epub 2014 Jun 11. J Parasitol. 2014. PMID: 24918961
-
Systematics of gastrointestinal nematodes of domestic ruminants: advances between 1992 and 1995 and proposals for future research.Vet Parasitol. 1997 Nov;72(3-4):225-38; discussion 238-45. doi: 10.1016/s0304-4017(97)00099-x. Vet Parasitol. 1997. PMID: 9460200 Review.
-
[Coprological diagnosis: what's new?].Parassitologia. 2004 Jun;46(1-2):137-9. Parassitologia. 2004. PMID: 15305703 Review. Italian.
Cited by
-
Improved diagnosis of Trichuris trichiura by using a bead-beating procedure on ethanol preserved stool samples prior to DNA isolation and the performance of multiplex real-time PCR for intestinal parasites.Parasitology. 2017 Jun;144(7):965-974. doi: 10.1017/S0031182017000129. Epub 2017 Mar 14. Parasitology. 2017. PMID: 28290266 Free PMC article.
-
Development of a multiplex fluorescence immunological assay for the simultaneous detection of antibodies against Cooperia oncophora, Dictyocaulus viviparus and Fasciola hepatica in cattle.Parasit Vectors. 2015 Jun 19;8:335. doi: 10.1186/s13071-015-0924-0. Parasit Vectors. 2015. PMID: 26084663 Free PMC article.
-
Methods for Quantification of Soil-Transmitted Helminths in Environmental Media: Current Techniques and Recent Advances.Trends Parasitol. 2015 Dec;31(12):625-639. doi: 10.1016/j.pt.2015.08.007. Epub 2015 Oct 1. Trends Parasitol. 2015. PMID: 26440788 Free PMC article. Review.
-
Metabarcoding study to reveal the structural community of strongylid nematodes in domesticated horses in Thailand.BMC Vet Res. 2024 Feb 24;20(1):70. doi: 10.1186/s12917-024-03934-y. BMC Vet Res. 2024. PMID: 38395874 Free PMC article.
-
Identification and management of infections caused by Giardia sp., Trichuris sp. and Demodex sp. in captive Brazilian porcupines (Coendou prehensilis).Int J Parasitol Parasites Wildl. 2024 Aug 30;25:100976. doi: 10.1016/j.ijppaw.2024.100976. eCollection 2024 Dec. Int J Parasitol Parasites Wildl. 2024. PMID: 39351490 Free PMC article.
References
-
- Cringoli G, Rinaldi L, Maurelli MP, Utzinger J (2010) FLOTAC: new multivalent techniques for qualitative and quantitative copromicroscopic diagnosis of parasites in animals and humans. Nat Protoc 5: 503–515. - PubMed
-
- Habtamu K, Degarege A, Ye-Ebiyo Y, Erko B (2011) Comparison of the Kato-Katz and FLOTAC techniques for the diagnosis of soil-transmitted helminth infections. Parasitol Int 60: 398–402. - PubMed
-
- Knopp S, Glinz D, Rinaldi L, Mohammed KA, N’Goran EK, et al. (2009) FLOTAC: a promising technique for detecting helminth eggs in human faeces. Trans R Soc Trop Med Hyg 103: 1190–1194. - PubMed
-
- Gasser RB (2006) Molecular tools–advances, opportunities and prospects. Vet Parasitol 136: 69–89. - PubMed
Publication types
MeSH terms
Substances
LinkOut - more resources
Full Text Sources
Other Literature Sources
Medical
Miscellaneous
