Complexation of c6-ceramide with cholesteryl phosphocholine - a potent solvent-free ceramide delivery formulation for cells in culture
- PMID: 23620740
- PMCID: PMC3631171
- DOI: 10.1371/journal.pone.0061290
Complexation of c6-ceramide with cholesteryl phosphocholine - a potent solvent-free ceramide delivery formulation for cells in culture
Abstract
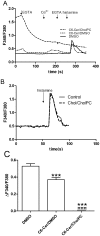
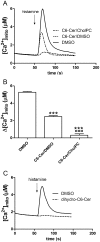
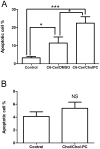
Ceramides are potent bioactive molecules in cells. However, they are very hydrophobic molecules, and difficult to deliver efficiently to cells. We have made fluid bilayers from a short-chain D-erythro-ceramide (C6-Cer) and cholesteryl phosphocholine (CholPC), and have used this as a formulation to deliver ceramide to cells. C6-Cer complexed with CholPC led to much larger biological effects in cultured cells (rat thyroid FRTL-5 and human HeLa cells in culture) compared to C6-Cer dissolved in dimethyl sulfoxide (DMSO). Inhibition of cell proliferation and induction of apoptosis was significantly more efficient by C6-Cer/CholPC compared to C6-Cer dissolved in DMSO. C6-Cer/CholPC also permeated cell membranes and caused mitochondrial Ca(2+) influx more efficiently than C6-Cer in DMSO. Even though CholPC was taken up by cells to some extent (from C6-Cer/CholPC bilayers), and was partially hydrolyzed to free cholesterol (about 9%), none of the antiproliferative effects were due to CholPC or excess cholesterol. The ceramide effect was not limited to D-erythro-C6-Cer, since L-erythro-C6-Cer and D-erythro-C6-dihydroCer also inhibited cell priolifereation and affected Ca(2+) homeostasis. We conclude that C6-Cer complexed to CholPC increased the bioavailability of the short-chain ceramide for cells, and potentiated its effects in comparison to solvent-dissolved C6-Cer. This new ceramide formulation appears to be superior to previous solvent delivery approaches, and may even be useful with longer-chain ceramides.
Conflict of interest statement
Figures


Similar articles
-
Metabolic Conversion of Ceramides in HeLa Cells - A Cholesteryl Phosphocholine Delivery Approach.PLoS One. 2015 Nov 24;10(11):e0143385. doi: 10.1371/journal.pone.0143385. eCollection 2015. PLoS One. 2015. PMID: 26599810 Free PMC article.
-
Cholesteryl phosphocholine--a study on its interactions with ceramides and other membrane lipids.Langmuir. 2013 Feb 19;29(7):2319-29. doi: 10.1021/la3051324. Epub 2013 Feb 4. Langmuir. 2013. PMID: 23356741
-
Bilayer Interactions among Unsaturated Phospholipids, Sterols, and Ceramide.Biophys J. 2017 Apr 25;112(8):1673-1681. doi: 10.1016/j.bpj.2017.03.016. Biophys J. 2017. PMID: 28445758 Free PMC article.
-
C6-ceramide and targeted inhibition of acid ceramidase induce synergistic decreases in breast cancer cell growth.Breast Cancer Res Treat. 2012 Jun;133(2):447-58. doi: 10.1007/s10549-011-1768-8. Epub 2011 Sep 21. Breast Cancer Res Treat. 2012. PMID: 21935601
-
Ceramide-1-phosphate in phagocytosis and calcium homeostasis.Adv Exp Med Biol. 2010;688:131-40. doi: 10.1007/978-1-4419-6741-1_9. Adv Exp Med Biol. 2010. PMID: 20919651 Free PMC article. Review.
Cited by
-
Metabolic Conversion of Ceramides in HeLa Cells - A Cholesteryl Phosphocholine Delivery Approach.PLoS One. 2015 Nov 24;10(11):e0143385. doi: 10.1371/journal.pone.0143385. eCollection 2015. PLoS One. 2015. PMID: 26599810 Free PMC article.
-
IL-10 constrains sphingolipid metabolism to limit inflammation.Nature. 2024 Mar;627(8004):628-635. doi: 10.1038/s41586-024-07098-5. Epub 2024 Feb 21. Nature. 2024. PMID: 38383790 Free PMC article.
References
-
- Barenholz Y, Thompson TE (1980) Sphingomyelins in bilayers and biological membranes. Biochimica et Biophysica Acta 604: 129–158. - PubMed
-
- Hannun YA, Luberto C, Argraves KM (2001) Enzymes of sphingolipid metabolism: from modular to integrative signaling. Biochemistry 40: 4893–903. - PubMed
-
- Ohvo-Rekila H, Ramstedt B, Leppimaki P, Slotte JP (2002) Cholesterol interactions with phospholipids in membranes. Prog Lipid Res 41: 66–97. - PubMed
Publication types
MeSH terms
Substances
LinkOut - more resources
Full Text Sources
Other Literature Sources
Miscellaneous

