

Sorafenib inhibits lymphoma xenografts by targeting MAPK/ERK and AKT pathways in tumor and vascular cells
- PMID: 23620775
- PMCID: PMC3631141
- DOI: 10.1371/journal.pone.0061603
Sorafenib inhibits lymphoma xenografts by targeting MAPK/ERK and AKT pathways in tumor and vascular cells
Abstract
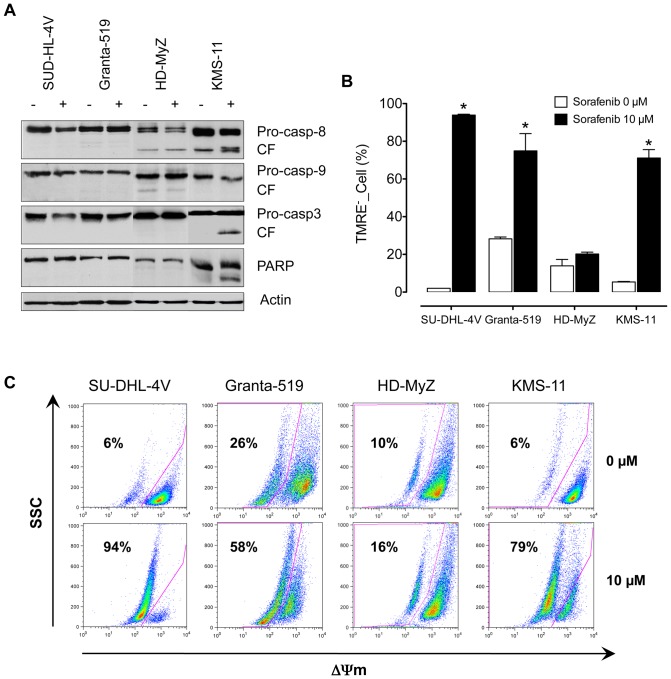
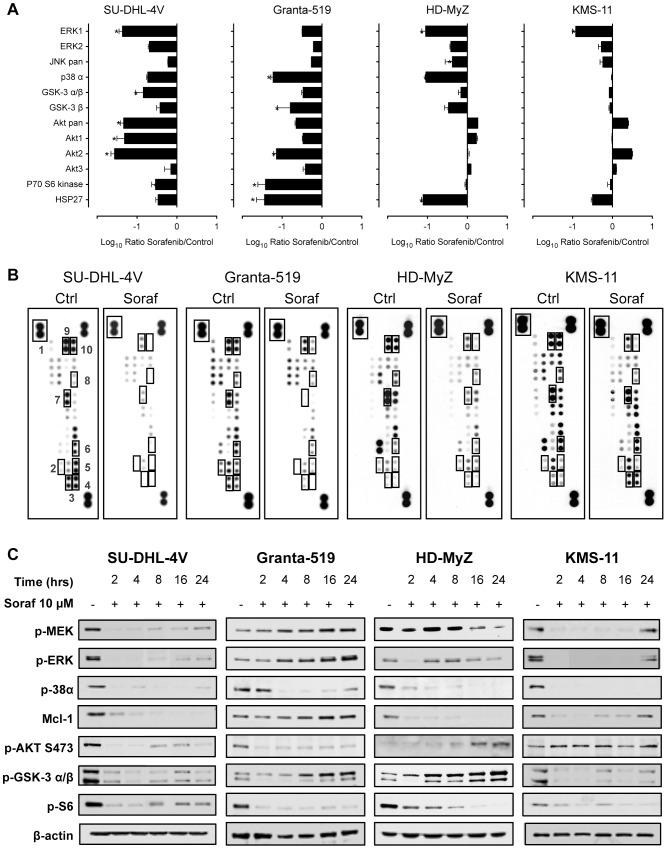
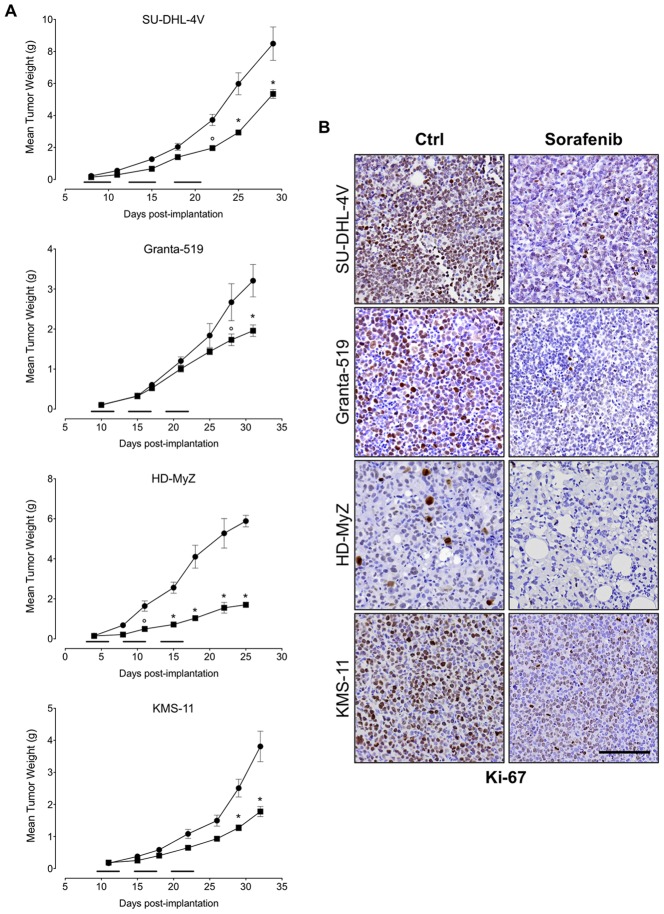
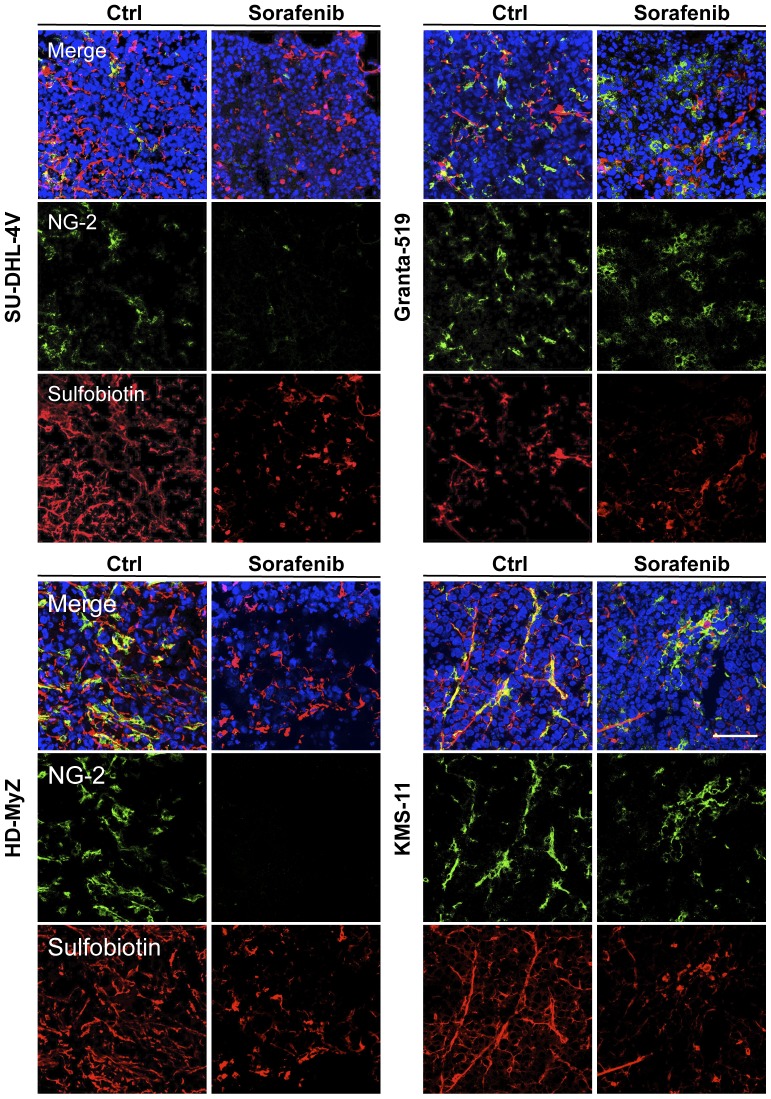
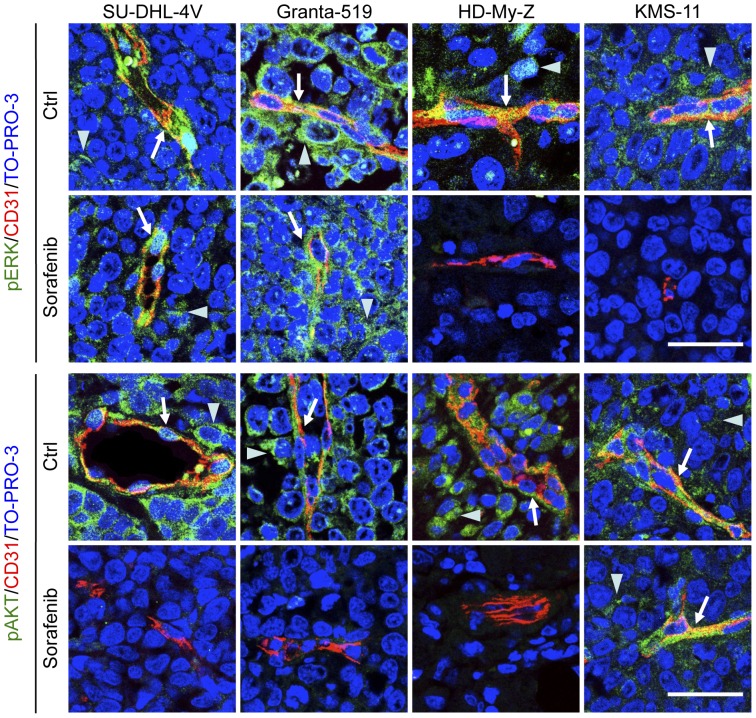
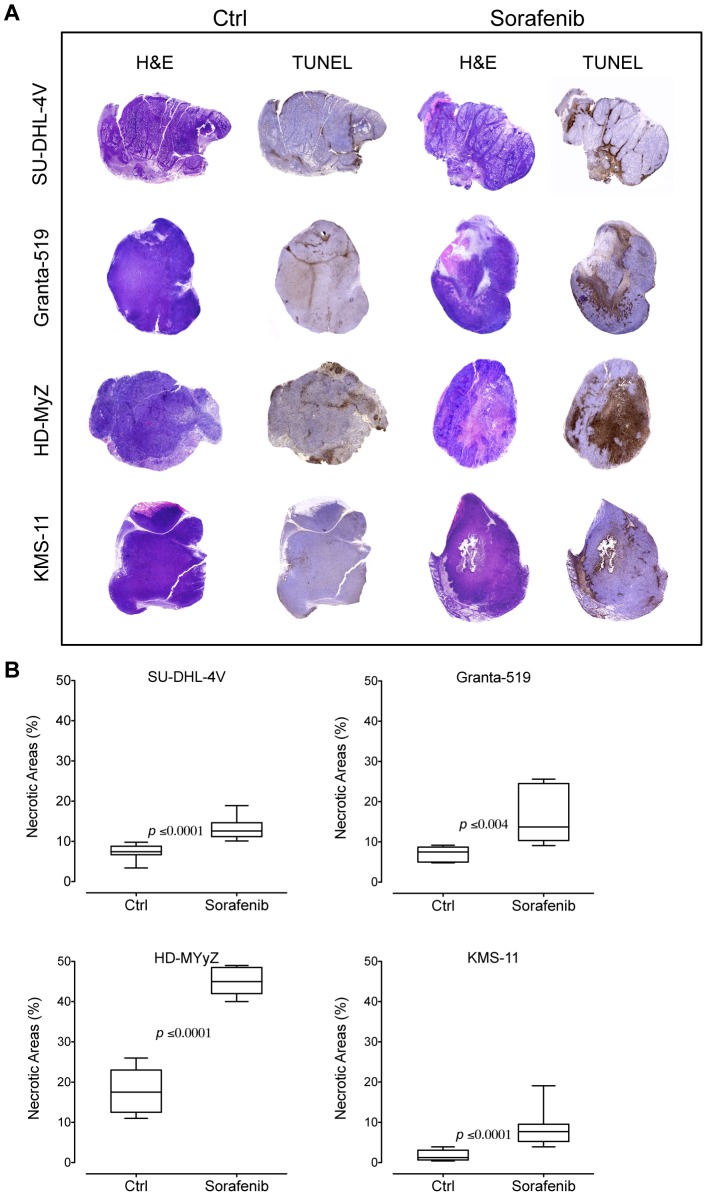
The anti-lymphoma activity and mechanism(s) of action of the multikinase inhibitor sorafenib were investigated using a panel of lymphoma cell lines, including SU-DHL-4V, Granta-519, HD-MyZ, and KMS-11 cell lines. In vitro, sorafenib significantly decreased cell proliferation and phosphorylation levels of MAPK and PI3K/Akt pathways while increased apoptotic cell death. In vivo, sorafenib treatment resulted in a cytostatic rather than cytotoxic effect on tumor cell growth associated with a limited inhibition of tumor volumes. However, sorafenib induced an average 50% reduction of tumor vessel density and a 2-fold increase of necrotic areas. Upon sorafenib treatment, endothelial and tumor cells from SU-DHL-4V, Granta-519, and KMS-11 nodules showed a potent inhibition of either phospho-ERK or phospho-AKT, whereas a concomitant inhibition of phospho-ERK and phospho-AKT was only observed in HD-MyZ nodules. In conclusion, sorafenib affects the growth of lymphoid cell lines by triggering antiangiogenic mechanism(s) and directly targeting tumor cells.
Conflict of interest statement
Figures


Similar articles
-
Inhibition of tumor endothelial ERK activation, angiogenesis, and tumor growth by sorafenib (BAY43-9006).Am J Pathol. 2006 Nov;169(5):1875-85. doi: 10.2353/ajpath.2006.050711. Am J Pathol. 2006. PMID: 17071608 Free PMC article.
-
Perifosine and sorafenib combination induces mitochondrial cell death and antitumor effects in NOD/SCID mice with Hodgkin lymphoma cell line xenografts.Leukemia. 2013 Aug;27(8):1677-87. doi: 10.1038/leu.2013.28. Epub 2013 Jan 30. Leukemia. 2013. PMID: 23360848
-
MK2206 overcomes the resistance of human liver cancer stem cells to sorafenib by inhibition of pAkt and upregulation of pERK.Tumour Biol. 2016 Jun;37(6):8047-55. doi: 10.1007/s13277-015-4707-1. Epub 2015 Dec 28. Tumour Biol. 2016. PMID: 26711788
-
Sorafenib and thyroid cancer.BioDrugs. 2013 Dec;27(6):615-28. doi: 10.1007/s40259-013-0049-y. BioDrugs. 2013. PMID: 23818056 Review.
-
Antiangiogenic therapy in oncology: current status and future directions.Lancet. 2016 Jul 30;388(10043):518-29. doi: 10.1016/S0140-6736(15)01088-0. Epub 2016 Feb 5. Lancet. 2016. PMID: 26853587 Review.
Cited by
-
Bone marrow-targetable Green Tea Catechin-Based Micellar Nanocomplex for synergistic therapy of Acute myeloid leukemia.J Nanobiotechnology. 2022 Nov 16;20(1):481. doi: 10.1186/s12951-022-01683-4. J Nanobiotechnology. 2022. PMID: 36384529 Free PMC article.
-
Quantitative proteomics and phosphoproteomics on serial tumor biopsies from a sorafenib-treated HCC patient.Proc Natl Acad Sci U S A. 2016 Feb 2;113(5):1381-6. doi: 10.1073/pnas.1523434113. Epub 2016 Jan 19. Proc Natl Acad Sci U S A. 2016. PMID: 26787912 Free PMC article.
-
Sorafenib combined with HER-2 targeted vaccination can promote effective T cell immunity in vivo.Int Immunopharmacol. 2017 May;46:112-123. doi: 10.1016/j.intimp.2017.02.028. Epub 2017 Mar 7. Int Immunopharmacol. 2017. PMID: 28282575 Free PMC article.
-
Estrogen receptor β ligation inhibits Hodgkin lymphoma growth by inducing autophagy.Oncotarget. 2017 Jan 31;8(5):8522-8535. doi: 10.18632/oncotarget.14338. Oncotarget. 2017. PMID: 28052027 Free PMC article.
-
Sorafenib Modulates the LPS- and Aβ-Induced Neuroinflammatory Response in Cells, Wild-Type Mice, and 5xFAD Mice.Front Immunol. 2021 May 27;12:684344. doi: 10.3389/fimmu.2021.684344. eCollection 2021. Front Immunol. 2021. PMID: 34122447 Free PMC article.
References
-
- Kane RC, Farrell AT, Saber H, Tang S, Williams G, et al. (2006) Sorafenib for the treatment of advanced renal cell carcinoma. Clinical Cancer Research 12: 7271–7278. - PubMed
-
- Escudier B, Eisen T, Stadler WM, Szczylik C, Oudard S, et al. (2007) Sorafenib in advanced clear-cell renal-cell carcinoma. The New England Journal of Medicine 356: 125–134. - PubMed
-
- Llovet JM, Ricci S, Mazzaferro V, Hilgard P, Gane E, et al. (2008) Sorafenib in advanced hepatocellular carcinoma. N Engl J Med 359: 378–390. - PubMed
-
- Clark JW, Eder JP, Ryan D, Lathia C, Lenz HJ (2005) Safety and pharmacokinetics of the dual action Raf kinase and vascular endothelial growth factor receptor inhibitor, BAY 43-9006, in patients with advanced, refractory solid tumors. Clinical Cancer Research 11: 5472–5480. - PubMed
-
- Strumberg D, Richly H, Hilger RA, Schleucher N, Korfee S, et al. (2005) Phase I clinical and pharmacokinetic study of the Novel Raf kinase and vascular endothelial growth factor receptor inhibitor BAY 43-9006 in patients with advanced refractory solid tumors. Journal of Clinical Oncology 23: 965–972. - PubMed
Publication types
MeSH terms
Substances
LinkOut - more resources
Full Text Sources
Other Literature Sources
Medical
Miscellaneous
