

Adaptation of phenylalanine and tyrosine catabolic pathway to hibernation in bats
- PMID: 23620802
- PMCID: PMC3631164
- DOI: 10.1371/journal.pone.0062039
Adaptation of phenylalanine and tyrosine catabolic pathway to hibernation in bats
Abstract
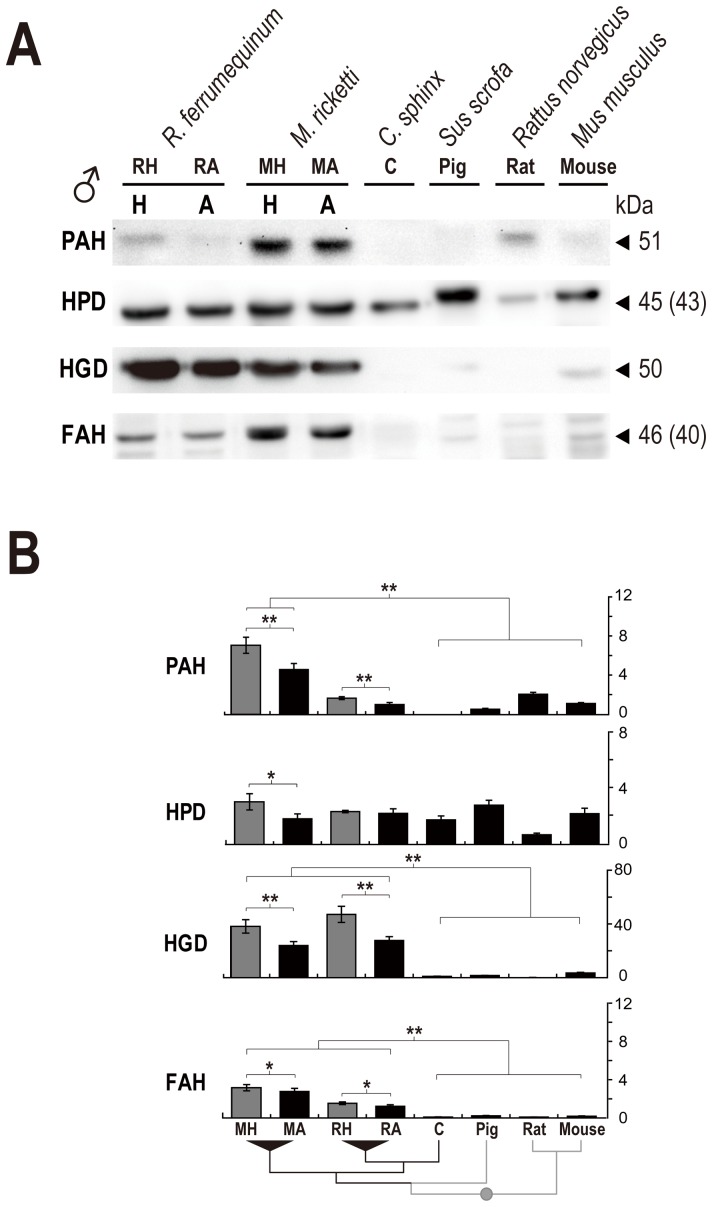
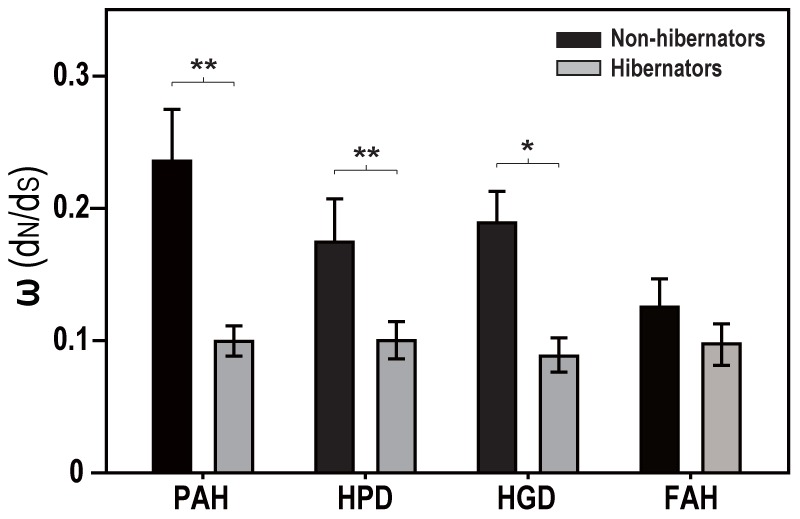
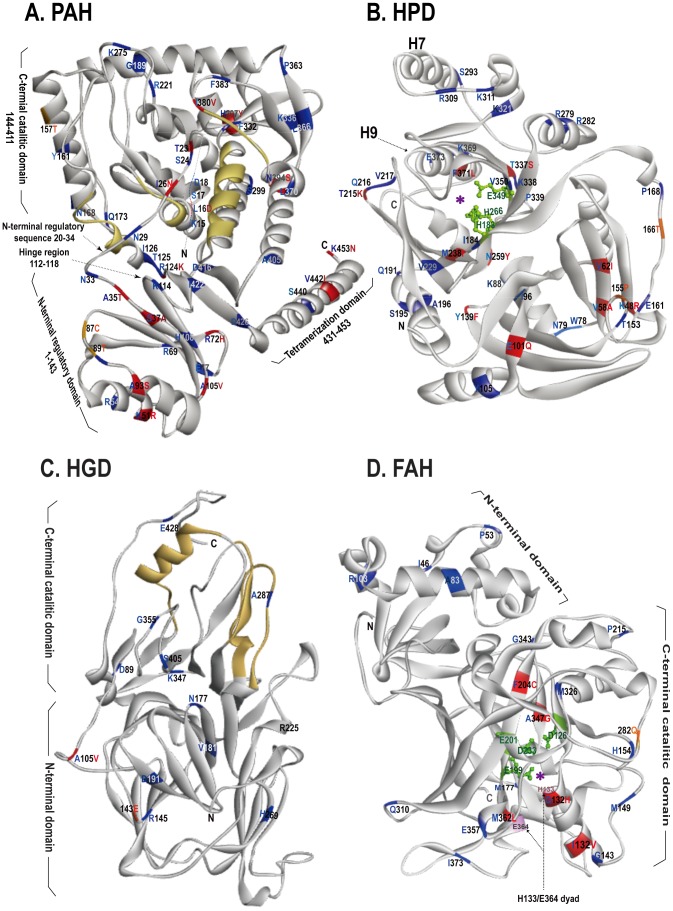
Some mammals hibernate in response to harsh environments. Although hibernating mammals may metabolize proteins, the nitrogen metabolic pathways commonly activated during hibernation are not fully characterized. In contrast to the hypothesis of amino acid preservation, we found evidence of amino acid metabolism as three of five key enzymes, including phenylalanine hydroxylase (PAH), homogentisate 1,2-dioxygenase (HGD), fumarylacetoacetase (FAH), involved in phenylalanine and tyrosine catabolism were co-upregulated during hibernation in two distantly related species of bats, Myotis ricketti and Rhinolophus ferrumequinum. In addition, the levels of phenylalanine in the livers of these bats were significantly decreased during hibernation. Because phenylalanine and tyrosine are both glucogenic and ketogenic, these results indicate the role of this catabolic pathway in energy supply. Since any deficiency in the catabolism of these two amino acids can cause accumulations of toxic metabolites, these results also suggest the detoxification role of these enzymes during hibernation. A higher selective constraint on PAH, HPD, and HGD in hibernators than in non-hibernators was observed, and hibernators had more conserved amino acid residues in each of these enzymes than non-hibernators. These conserved amino acid residues are mostly located in positions critical for the structure and activity of the enzymes. Taken together, results of this work provide novel insights in nitrogen metabolism and removal of harmful metabolites during bat hibernation.
Conflict of interest statement
Figures


Similar articles
-
Adaptation of peroxisome proliferator-activated receptor alpha to hibernation in bats.BMC Evol Biol. 2015 May 17;15:88. doi: 10.1186/s12862-015-0373-6. BMC Evol Biol. 2015. PMID: 25980933 Free PMC article.
-
Adaptation of the FK506 binding protein 1B to hibernation in bats.Cryobiology. 2018 Aug;83:1-8. doi: 10.1016/j.cryobiol.2018.07.004. Epub 2018 Jul 6. Cryobiology. 2018. PMID: 30056853
-
Antioxidant Defenses in the Brains of Bats during Hibernation.PLoS One. 2016 Mar 24;11(3):e0152135. doi: 10.1371/journal.pone.0152135. eCollection 2016. PLoS One. 2016. PMID: 27010916 Free PMC article.
-
Trade-offs Influencing the Physiological Ecology of Hibernation in Temperate-Zone Bats.Integr Comp Biol. 2017 Dec 1;57(6):1214-1224. doi: 10.1093/icb/icx087. Integr Comp Biol. 2017. PMID: 28985332 Review.
-
Advances in molecular biology of hibernation in mammals.Bioessays. 2007 May;29(5):431-40. doi: 10.1002/bies.20560. Bioessays. 2007. PMID: 17450592 Review.
Cited by
-
Comparison of brain transcriptome of the greater horseshoe bats (Rhinolophus ferrumequinum) in active and torpid episodes.PLoS One. 2014 Sep 24;9(9):e107746. doi: 10.1371/journal.pone.0107746. eCollection 2014. PLoS One. 2014. PMID: 25251558 Free PMC article.
-
Proteomics approaches shed new light on hibernation physiology.J Comp Physiol B. 2015 Aug;185(6):607-27. doi: 10.1007/s00360-015-0905-9. Epub 2015 May 15. J Comp Physiol B. 2015. PMID: 25976608 Review.
-
Co-activation of Akt, Nrf2, and NF-κB signals under UPRER in torpid Myotis ricketti bats for survival.Commun Biol. 2020 Nov 11;3(1):658. doi: 10.1038/s42003-020-01378-2. Commun Biol. 2020. PMID: 33177645 Free PMC article.
-
Down but Not Out: The Role of MicroRNAs in Hibernating Bats.PLoS One. 2015 Aug 5;10(8):e0135064. doi: 10.1371/journal.pone.0135064. eCollection 2015. PLoS One. 2015. PMID: 26244645 Free PMC article.
-
Homocysteine homeostasis and betaine-homocysteine S-methyltransferase expression in the brain of hibernating bats.PLoS One. 2013 Dec 23;8(12):e85632. doi: 10.1371/journal.pone.0085632. eCollection 2013. PLoS One. 2013. PMID: 24376891 Free PMC article.
References
-
- Carey HV, Andrews MT, Martin SL (2003) Mammalian hibernation: cellular and molecular responses to depressed metabolism and low temperature. Physiol Rev 83: 1153–1181. - PubMed
-
- Geiser F (2013) Hibernation. Current Biology 23 (5): R188–R193. - PubMed
-
- Morin P Jr, Storey KB (2009) Mammalian hibernation: differential gene expression and novel application of epigenetic controls. Int J Dev Biol 53: 433–442. - PubMed
-
- Kondo N, Sekijima T, Kondo J, Takamatsu N, Tohya K, et al. (2006) Circannual control of hibernation by HP complex in the brain. Cell 125: 161–172. - PubMed
Publication types
MeSH terms
Substances
LinkOut - more resources
Full Text Sources
Other Literature Sources
Miscellaneous
