

Color discrimination in the tufted capuchin monkey, Sapajus spp
- PMID: 23620819
- PMCID: PMC3631197
- DOI: 10.1371/journal.pone.0062255
Color discrimination in the tufted capuchin monkey, Sapajus spp
Abstract
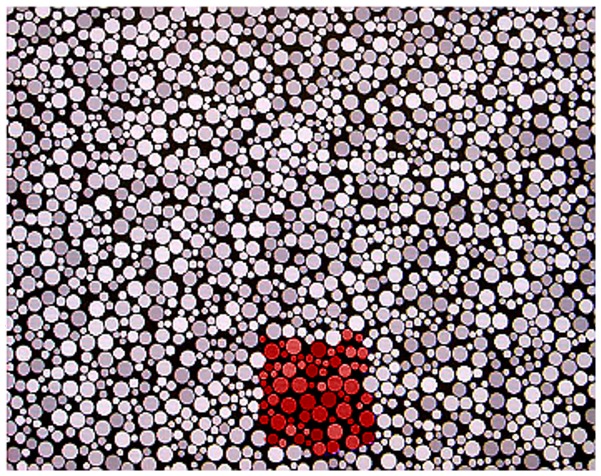
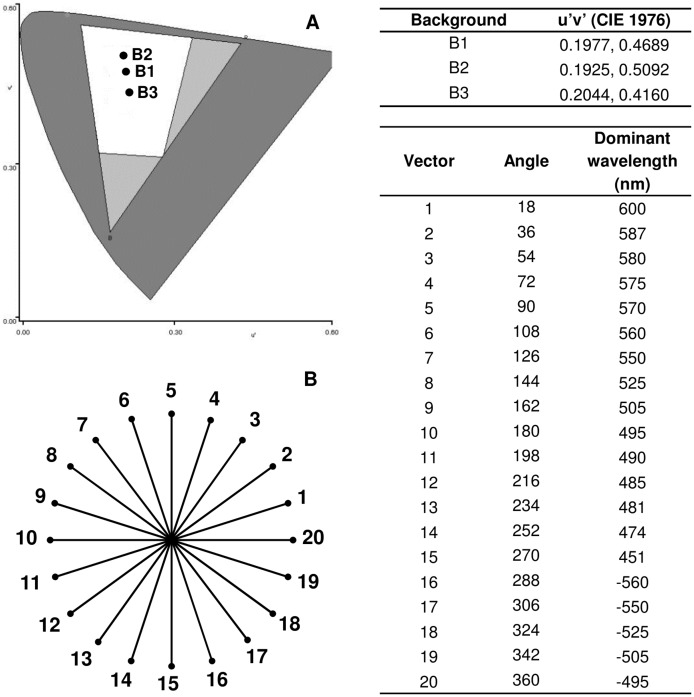
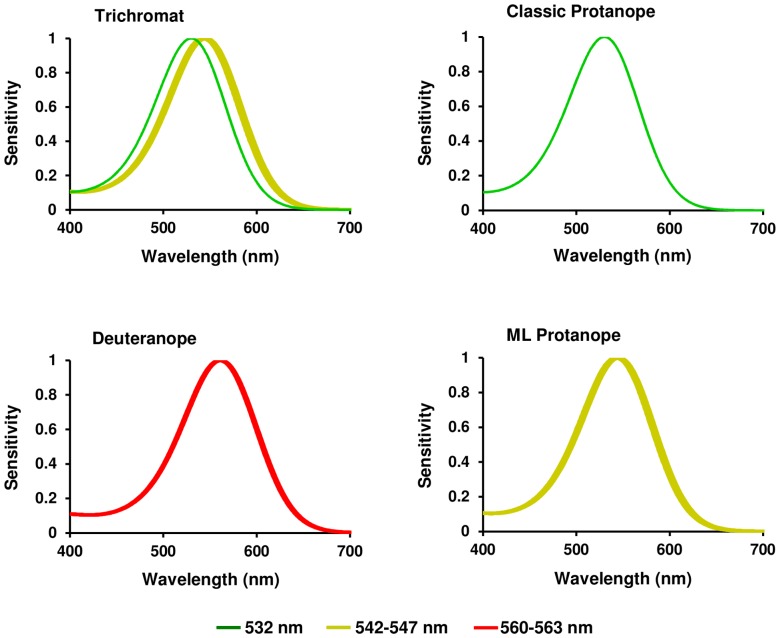
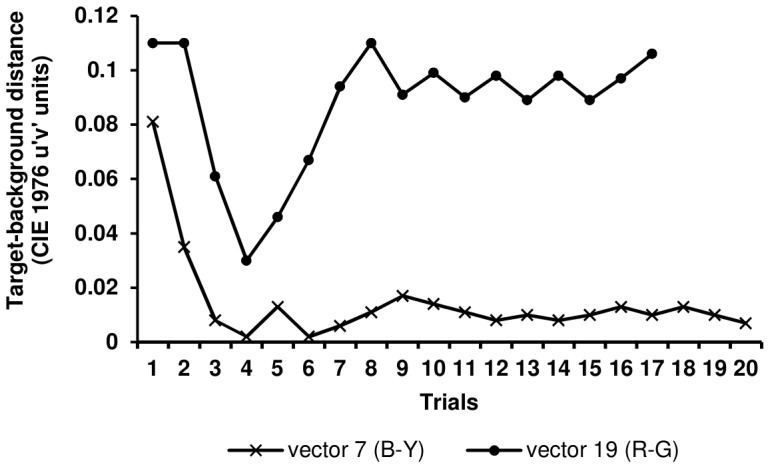
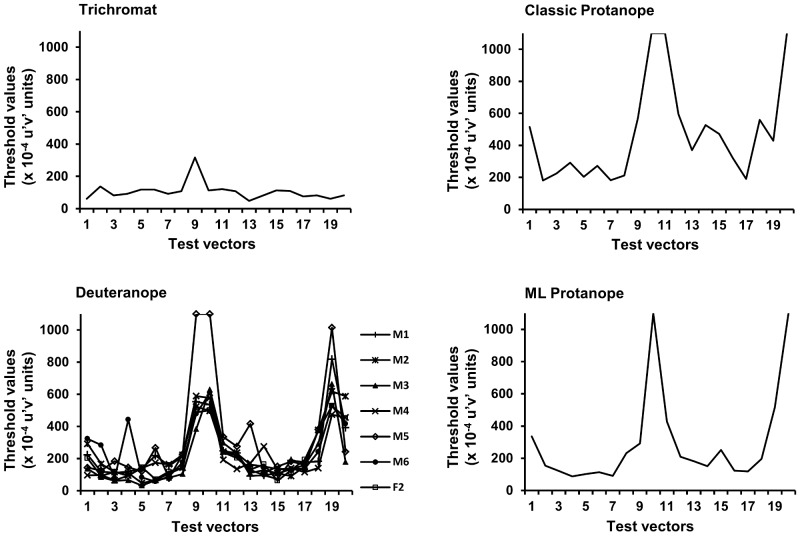
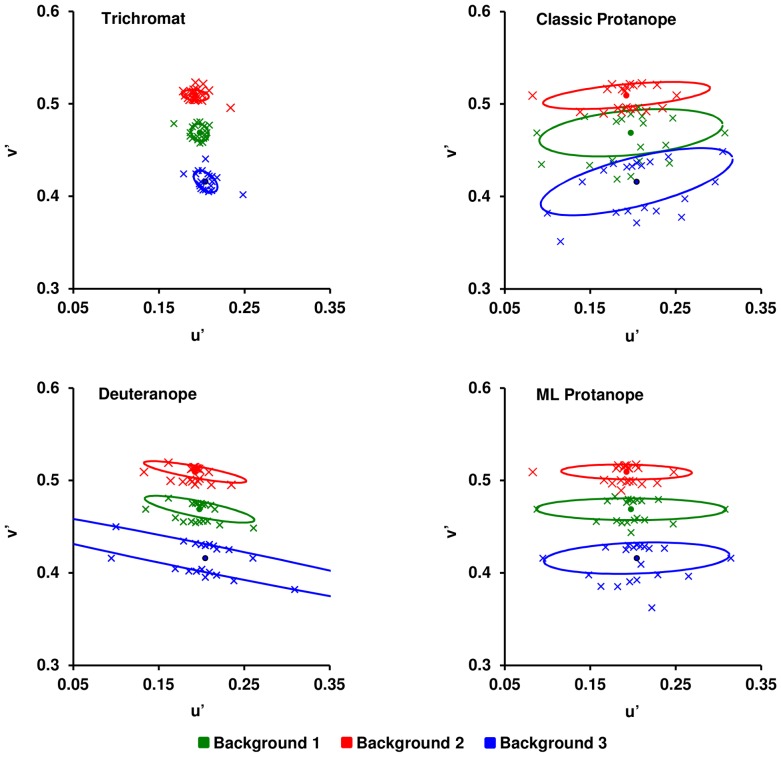
The present study evaluated the efficacy of an adapted version of the Mollon-Reffin test for the behavioral investigation of color vision in capuchin monkeys. Ten tufted capuchin monkeys (Sapajus spp., formerly referred to as Cebus apella) had their DNA analyzed and were characterized as the following: one trichromat female, seven deuteranope dichromats (six males and one female), and two protanope males, one of which was identified as an "ML protanope." For their behavioral characterization, all of the subjects were tested at three regions of the Commission International de l'Eclairage (CIE) 1976 u'v' diagram, with each test consisting of 20 chromatic variation vectors that were radially distributed around the chromaticity point set as the test background. The phenotypes inferred from the behavioral data were in complete agreement with those predicted from the genetic analysis, with the threshold distribution clearly differentiating between trichromats and dichromats and the estimated confusion lines characteristically converging for deuteranopes and the "classic" protanope. The discrimination pattern of the ML protanope was intermediate between protan and deutan, with confusion lines horizontally oriented and parallel to each other. The observed phenotypic differentiation confirmed the efficacy of the Mollon-Reffin test paradigm as a useful tool for evaluating color discrimination in nonhuman primates. Especially noteworthy was the demonstration of behavioral segregation between the "classic" and "ML" protanopes, suggesting identifiable behavioral consequences of even slight variations in the spectral sensitivity of M/L photopigments in dichromats.
Conflict of interest statement
Figures
Similar articles
-
Behavioral and genetic color vision evaluation of an albino male capuchin monkey (Sapajus apella).J Comp Physiol A Neuroethol Sens Neural Behav Physiol. 2019 Aug;205(4):529-536. doi: 10.1007/s00359-019-01342-4. Epub 2019 May 20. J Comp Physiol A Neuroethol Sens Neural Behav Physiol. 2019. PMID: 31111183
-
Chromatic discrimination in fixed saturation levels from tufted capuchin monkeys with different color vision genotypes.J Comp Physiol A Neuroethol Sens Neural Behav Physiol. 2024 Jan;210(1):47-56. doi: 10.1007/s00359-023-01644-8. Epub 2023 Jun 2. J Comp Physiol A Neuroethol Sens Neural Behav Physiol. 2024. PMID: 37268825
-
Specificity of the chromatic noise influence on the luminance contrast discrimination to the color vision phenotype.Sci Rep. 2020 Oct 21;10(1):17897. doi: 10.1038/s41598-020-74875-3. Sci Rep. 2020. PMID: 33087826 Free PMC article.
-
Anointing variation across wild capuchin populations: a review of material preferences, bout frequency and anointing sociality in Cebus and Sapajus.Am J Primatol. 2012 Apr;74(4):299-314. doi: 10.1002/ajp.20971. Epub 2011 Jul 18. Am J Primatol. 2012. PMID: 21769906 Review.
-
Bipolar cell pathways for color vision in non-primate dichromats.Vis Neurosci. 2011 Jan;28(1):51-60. doi: 10.1017/S0952523810000271. Epub 2010 Nov 12. Vis Neurosci. 2011. PMID: 21070688 Review.
Cited by
-
Behavioral and genetic color vision evaluation of an albino male capuchin monkey (Sapajus apella).J Comp Physiol A Neuroethol Sens Neural Behav Physiol. 2019 Aug;205(4):529-536. doi: 10.1007/s00359-019-01342-4. Epub 2019 May 20. J Comp Physiol A Neuroethol Sens Neural Behav Physiol. 2019. PMID: 31111183
-
Uniform trichromacy in Alouatta caraya and Alouatta seniculus: behavioural and genetic colour vision evaluation.Front Zool. 2021 Jul 8;18(1):36. doi: 10.1186/s12983-021-00421-0. Front Zool. 2021. PMID: 34238318 Free PMC article.
-
Low number of luminance levels in the luminance noise increases color discrimination thresholds estimated with pseudoisochromatic stimuli.Front Psychol. 2014 Dec 23;5:1291. doi: 10.3389/fpsyg.2014.01291. eCollection 2014. Front Psychol. 2014. PMID: 25566106 Free PMC article.
-
Ganglion cells and displaced amacrine cells density in the retina of the collared peccary (Pecari tajacu).PLoS One. 2020 Oct 1;15(10):e0239719. doi: 10.1371/journal.pone.0239719. eCollection 2020. PLoS One. 2020. PMID: 33002017 Free PMC article.
-
Color Discrimination Is Affected by Modulation of Luminance Noise in Pseudoisochromatic Stimuli.Front Psychol. 2016 Jul 6;7:1006. doi: 10.3389/fpsyg.2016.01006. eCollection 2016. Front Psychol. 2016. PMID: 27458404 Free PMC article.
References
-
- Grether WF (1937) Red-vision deficiency in Cebus monkeys. Psychol Bull 34: 792–793.
-
- Grether WF (1939) Color vision and color blindness in monkeys. Comp Psychol Monogr 15: 38.
-
- Gunter R, Feigenson L, Blakeslee B (1965) Color vision in the Cebus monkey. J Comp Physiol Psychol 60: 107–113. - PubMed
-
- Jacobs GH (1984) Within-species variations in visual capacity among squirrel monkey (Sairmiri sciureus): color vision. Vision Res 24: 1267–1277. - PubMed
-
- Jacobs GH, Blakeslee B (1984) Individual variations in color vision among squirrel monkeys (Saimiri sciureus) of different geographical origins. J Comp Psychol 98: 347–357. - PubMed
Publication types
MeSH terms
Substances
Grants and funding
LinkOut - more resources
Full Text Sources
Other Literature Sources
Miscellaneous
