. 2013 Apr 27:13:69.
doi: 10.1186/1471-2229-13-69.

Silencing of Nicotiana benthamiana Neuroblastoma-Amplified Gene causes ER stress and cell death

Affiliations

Silencing of Nicotiana benthamiana Neuroblastoma-Amplified Gene causes ER stress and cell death

Jae-Yong Lee et al. BMC Plant Biol. .

Abstract

Background: Neuroblastoma Amplified Gene (NAG) was identified as a gene co-amplified with the N-myc gene, whose genomic amplification correlates with poor prognosis of neuroblastoma. Later it was found that NAG is localized in endoplasmic reticulum (ER) and is a component of the syntaxin 18 complex that is involved in Golgi-to-ER retrograde transport in human cells. Homologous sequences of NAG are found in plant databases, but its function in plant cells remains unknown.

Results: Nicotiana benthamania Neuroblastoma-Amplified Gene (NbNAG) encodes a protein of 2,409 amino acids that contains the secretory pathway Sec39 domain and is mainly localized in the ER. Silencing of NbNAG by virus-induced gene silencing resulted in growth arrest and acute plant death with morphological markers of programmed cell death (PCD), which include chromatin fragmentation and modification of mitochondrial membrane potential. NbNAG deficiency caused induction of ER stress genes, disruption of the ER network, and relocation of bZIP28 transcription factor from the ER membrane to the nucleus, similar to the phenotypes of tunicamycin-induced ER stress in a plant cell. NbNAG silencing caused defects in intracellular transport of diverse cargo proteins, suggesting that a blocked secretion pathway by NbNAG deficiency causes ER stress and programmed cell death.

Conclusions: These results suggest that NAG, a conserved protein from yeast to mammals, plays an essential role in plant growth and development by modulating protein transport pathway, ER stress response and PCD.


Figures
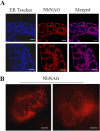
Figure 1
Figure 1
ER localization of NbNAG in tobacco BY-2 cells. A. BY-2 cells were immunolabeled with anti-NbNAG antibodies and briefly stained with ER. Tracker™ Blue-White DPX as an ER marker for observation with confocal laser scanning microscopy. Scale bars: 10 μm. B. After immunolabeling, the BY-2 cells were examined by fluorescence microscopy. Fluorescent and bright field images are shown. Scale bars: 10 μm.
Figure 2
Figure 2
Histochemical localization of AtNAG promoter-GUS expression in Arabidopsis. In Arabidopsis transgenic plants carrying the Arabidopsis NAG (AtNAG) promoter-GUS fusion gene, GUS staining is shown in the following tissues: shoot of a seedling at 4 days after germination (DAG) (A); shoot apex and leaf primordia at 4 DAG (B) and 7 DAG (C); vascular bundles in the cotyledon (D) and the hypocotyl (E) at 4 DAG; vasculature (F and G) and stomata (F and H) of a true leaf at 7 DAG; hypocotyl-root junction at 4 DAG (I); root vasculature and emerging lateral root (J); flower buds and axillary buds in the reproductive stage (K), and enlarged pictures of the flower buds (L) and the axillary buds (M); a seedling at 2 DAG upon tunicamycin (TM) treatment at 0 (N), 0.25 (O), and 0.5 μg/ml (P). Scale bars: A = 2 mm, B, C, I, and L = 0.5 mm, D, G, and N-P = 200 μm, E and J = 100 μm, F and M = 1 mm, H = 20 μm, K = 1 cm.
Figure 3
Figure 3
VIGS constructs, phenotypes, and suppression of the NbNAG transcripts. A Schematic drawing showing NbNAG structure and two VIGS constructs, TRV:NAG(N1) and TRV:NAG(N2), each containing a different NbNAG cDNA fragment (indicated by bars). The primer set used for RT-PCR is also indicated. B Semiquantitative RT-PCR analysis of NbNAG transcript levels. Three independent VIGS plants were analyzed for TRV:NAG(N1) and TRV:NAG(N2) lines. The actin mRNA level was included as a control. C-F Cell death phenotypes of TRV:NAG VIGS plants. Photographs of the plants were taken at 25 days after infiltration (DAI). G Cell death phenotypes of TRV:NAG VIGS plants at 15 DAI. H and I Root growth of TRV (left) and TRV:NAG lines (right) at 15 (H) and 25 DAI (I). J-M Hand-cut sections of the petiole of the fourth leaf above the infiltrated leaf (J and K) and the stem where the fourth leaf above the infiltrated leaf was attached (L and M) from TRV (J and L) and TRV:NAG lines (K and M) at 15 DAI. Brown-colored dead cells in the vasculature are indicated by the arrows. Scale bars: 200 μm. N and O The stem sections shown in (L and M) were observed under fluorescence microscopy to detect autofluorescent secondary metabolites in TRV (N) and TRV:NAG lines (O). The arrow indicates the autofluorescence around the stem vasculature that undergoes cell death.
Figure 4
Figure 4
Phenotypes of programmed cell death. A Representative light micrographs of the abaxial leaf epidermis of TRV control and TRV:NAG lines (20 DAI). Scale bars: 100 μm. B Nuclear degradation. Fluorescence micrographs of abaxial leaf epidermal cells from VIGS lines (20 DAI) after nuclear staining with 4',6-diamidino-2-phenylindole (DAPI; 100 μg/ml). C Oligonucleosomal DNA fragmentation. Genomic Southern blotting was performed using total genomic DNA of N. benthamiana as a probe. D-F Mitochondrial membrane integrity. Leaf protoplasts from VIGS lines (20 DAI) were observed after staining with TMRM (200 nM) (D). TMRM fluorescence (E) and chlorophyll autofluorescence (F) were quantified. Data points represent means ± SD of 20 individual protoplasts. Significant differences between control and other samples were indicated by one (P≤0.05) or two (P≤0.01) asterisks. PIV, pixel intensity values. G and H ROS production. Leaf protoplasts were incubated with a ROS indicator H2DCFDA (2 μM) (G). Fluorescence of protoplasts from the VIGS lines was quantified by pixel intensity (H). Data points represent means ± SD of 30 individual protoplasts. Scale bars: 50μm.
Figure 5
Figure 5
Inhibition of intracellular trafficking of diverse cargo proteins. A Vacuolar localization of sporamin:GFP, a fusion protein between sporamin and green fluorescent protein (GFP). Protoplasts isolated from TRV and TRV:NAG leaves were transformed with the sporamin:GFP construct. Fluorescent and bright field images are shown. Red fluorescence indicates chlorophyll autofluorescence. Scale bars: 10 μm. B Localization of invertase:GFP. Because invertase:GFP is a secretory protein, its fluorescence was not readily detected within protoplasts of TRV control . Scale bars: 10 μm. C Localization of GKX. GKX is a chimeric ER membrane marker [27]. Scale bars: 10 μm. D Localization of GFP control in the cytosol and the nucleus of TRV protoplasts. Scale bars:10 μm. E Trafficking assay of sporamin:GFP. Protein extracts prepared from protoplasts transformed with the sporamin:GFP construct were analyzed by western blotting using anti-GFP antibody. Mock indicates untransformed TRV protoplasts. F Trafficking assay of invertase:GFP. Protein extracts prepared from protoplasts (P) and medium (M) were analyzed by western blotting using anti-GFP antibody. G Endo H resistance of GKX glycans. Protein extracts from protoplasts transformed with the GKX construct were treated with endo H and analyzed by western blotting using anti-GFP antibody. S and R indicate endo H-sensitive GKX proteins (ER form) and endo H-resistant proteins (Golgi form), respectively.
Figure 6
Figure 6
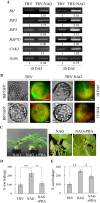
ER stress phenotypes. A Semiquantitative RT-PCR analysis of transcript levels of ER stress-related genes in TRV and TRV:NAG leaves at 10 and 20 DAI. Relative band intensity was shown below the bands. B Altered ER morphology. As an ER marker, BiP:GFP construct was transformed into leaf protoplasts of TRV and TRV:NAG lines at 10 and 15 DAI. BiP is a HSP70 chaperone located in the ER lumen. Red fluorescence indicates chlorophyll autofluorescence. Scale bars: 10 μm. C Effect of the chemical chaperone 4-phenyl butyric acid (PBA) on growth retardation and cell death phenotypes in TRV:NAG VIGS lines at 25 DAI. Representative plants are shown. D and E Relative ion leakage (%) of the 4th leaf above the infiltrated leaf (D) and the leaf near the shoot apex (E). Each value represents the mean ± SD of three replicates per experiment.
Figure 7
Figure 7
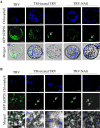
Subcellular localization of GFP:bZIP28. A TRV control, tunicamycin (TM)-treated TRV, and TRV:NAG plants (15 DAI) were infiltrated with Agrobacterium containing GFP:bZIP28 construct. After 24 h, protoplasts were isolated and localization of GFP fluorescent signals was examined by confocal laser scanning microscopy. Representative images of the protoplasts are shown. Scale bars: 10 μm. B After agroinfiltration of the GFP:bZIP28 construct, leaf epidermal cells were observed by confocal microscopy. Scale bars: 20 μm.

Similar articles

Cited by

References

    1. Vaux DL, Korsmeyer SJ. Cell death in development. Cell. 1999;96:245–254. doi: 10.1016/S0092-8674(00)80564-4. - DOI - PubMed
    1. Wertz IE, Hanley MR. Diverse molecular provocation of programmed cell death. Trends Biochem Sci. 1996;21:359–364. - PubMed
    1. Lam E, Kato N, Lawton M. Programmed cell death, mitochondria and the plant hypersensitive response. Nature. 2001;411:848–853. doi: 10.1038/35081184. - DOI - PubMed
    1. Reape TJ, McCabe PF. Apoptotic-like programmed cell death in plants. New Phytol. 2008;180:13–26. doi: 10.1111/j.1469-8137.2008.02549.x. - DOI - PubMed
    1. Szegezdi E, Logue SE, Gorman AM, Samali A. Mediators of endoplasmic reticulum stress-induced apoptosis. EMBO Rep. 2006;7:880–885. doi: 10.1038/sj.embor.7400779. - DOI - PMC - PubMed

Publication types

Associated data