. 2013 Apr 26;45(1):11.
doi: 10.1186/1297-9686-45-11.

Genomic selection of purebred animals for crossbred performance in the presence of dominant gene action

Affiliations

Genomic selection of purebred animals for crossbred performance in the presence of dominant gene action

Jian Zeng et al. Genet Sel Evol. .

Abstract

Background: Genomic selection is an appealing method to select purebreds for crossbred performance. In the case of crossbred records, single nucleotide polymorphism (SNP) effects can be estimated using an additive model or a breed-specific allele model. In most studies, additive gene action is assumed. However, dominance is the likely genetic basis of heterosis. Advantages of incorporating dominance in genomic selection were investigated in a two-way crossbreeding program for a trait with different magnitudes of dominance. Training was carried out only once in the simulation.

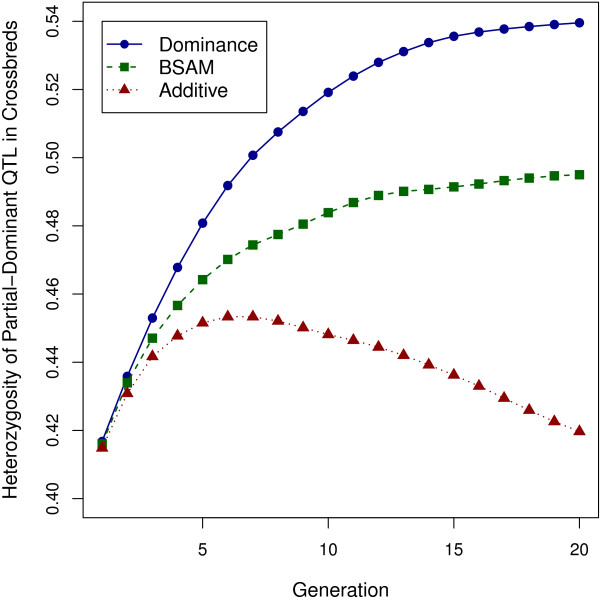
Results: When the dominance variance and heterosis were large and overdominance was present, a dominance model including both additive and dominance SNP effects gave substantially greater cumulative response to selection than the additive model. Extra response was the result of an increase in heterosis but at a cost of reduced purebred performance. When the dominance variance and heterosis were realistic but with overdominance, the advantage of the dominance model decreased but was still significant. When overdominance was absent, the dominance model was slightly favored over the additive model, but the difference in response between the models increased as the number of quantitative trait loci increased. This reveals the importance of exploiting dominance even in the absence of overdominance. When there was no dominance, response to selection for the dominance model was as high as for the additive model, indicating robustness of the dominance model. The breed-specific allele model was inferior to the dominance model in all cases and to the additive model except when the dominance variance and heterosis were large and with overdominance. However, the advantage of the dominance model over the breed-specific allele model may decrease as differences in linkage disequilibrium between the breeds increase. Retraining is expected to reduce the advantage of the dominance model over the alternatives, because in general, the advantage becomes important only after five or six generations post-training.

Conclusion: Under dominance and without retraining, genomic selection based on the dominance model is superior to the additive model and the breed-specific allele model to maximize crossbred performance through purebred selection.


Figures

Figure 1
Figure 1
Schematic representation of the simulated population history and the two-way crossbreeding program. The crossbreeding program consisted of 20 generations of purebred selection for crossbred performance; crossbred AB0 is the training population; AM and BM represent the selected breed A and B males, AF and BF the selected breed A and B females; lines with arrows denote reproduction, while lines without arrows denote selection.
Figure 2
Figure 2
Cumulative response to genomic selection with one chromosome. Cumulative response to GS was computed using the dominance model, BSAM and the additive model in the four scenarios, when there was one chromosome, 100 QTL and 1000 SNPs; the plotted cumulative responses are means from 1600 replicates, standardized by the phenotypic standard deviation of crossbreds in generation 0: (a) results from scenario 1, where VD was large with overdominance, (b) results from scenario 2, where VD was realistic with overdominance, (c) results from scenario 3, where VD was realistic without overdominance and (d) results from scenario 4, where dominance was absent.
Figure 3
Figure 3
Cumulative response to genomic selection with ten chromosomes. Cumulative response to GS was computed using the dominance model, BSAM and the additive model in the four scenarios, when there were ten chromosomes, 1000 QTL and 10 000 SNPs; the plotted cumulative responses are means from 1600 replicates, standardized by the phenotypic standard deviation of crossbreds in generation 0: (a) results from scenario 1, where VD was large with overdominance, (b) results from scenario 2, where VD was realistic with overdominance, (c) results from scenario 3, where VD was realistic without overdominance and (d) results from scenario 4, where dominance was absent.
Figure 4
Figure 4
Cumulative response for breed average and heterosis in crossbreds. Cumulative response for breed average (red crosses) and heterosis in crossbreds (blue dots) was computed from scenario 1, with large VD and allowing overdominance, when there was one chromosome, 100 QTL and 1000 SNPs; the plotted cumulative responses are means from 1600 replicates, standardized by the phenotypic standard deviation of crossbreds in generation 0: (a) cumulative response using the dominance model (y-axis) plotted against response using the additive model (x-axis), (b) cumulative response using the dominance model against response using BSAM and (c) cumulative response using BSAM against the additive model; the broken line is y=x.
Figure 5
Figure 5
Changes in heterozygosity for over-dominant QTL in crossbreds over generations. The plotted values are changes in heterozygosity for over-dominant QTL in crossbreds over generations of selection, under the dominance model, BSAM and the additive model, in scenario 1, with one chromosome and large dominance, averaged over 1600 replicates.
Figure 6
Figure 6
Changes in allele frequencies of two over-dominant QTL in the parental breeds over generations. The plotted values are changes in allele frequencies of two over-dominant QTL with major dominance effects in the sire and dam breeds over generations of selection, under the additive model and the dominance model, in scenario 1, with one chromosome and large dominance; results are means from 100 replicates in a given random simulation: (a) shows alternate alleles approaching fixation in the sire and dam breeds more rapidly with the dominance than the additive model and (b) shows the same allele approaching fixation in both parental breeds with the additive model, in contrast to the dominance model.

References

    1. Meuwissen TH, Hayes BJ, Goddard ME. Prediction of total genetic value using genome-wide dense marker maps. Genetics. 2001;157:1819–1829. - PMC - PubMed
    1. VanRaden PM, Van Tassell CP, Wiggans GR, Sonstegard TS, Schnabel RD, Taylor JF, Schenkel FS. Invited review: reliability of genomic predictions for North American Holstein bulls. J Dairy Sci. 2009;92:16–24. doi: 10.3168/jds.2008-1514. - DOI - PubMed
    1. Hayes BJ, Bowman PJ, Chamberlain AJ, Goddard ME. Invited review: Genomic selection in dairy cattle: progress and challenges. J Dairy Sci. 2009;92:433–443. doi: 10.3168/jds.2008-1646. - DOI - PubMed
    1. Habier D, Fernando RL, Dekkers JCM. The impact of genetic relationship information on genome-assisted breeding values. Genetics. 2007;177:2389–2397. - PMC - PubMed
    1. Habier D, Tetens J, Seefried FR, Lichtner P, Thaller G. The impact of genetic relationship information on genomic breeding values in German Holstein cattle. Genet Sel Evol. 2010;42:5. doi: 10.1186/1297-9686-42-5. - DOI - PMC - PubMed

Publication types

LinkOut - more resources