

Genetic and environmental factors affecting cryptic variations in gene regulatory networks
- PMID: 23622056
- PMCID: PMC3679780
- DOI: 10.1186/1471-2148-13-91
Genetic and environmental factors affecting cryptic variations in gene regulatory networks
Abstract
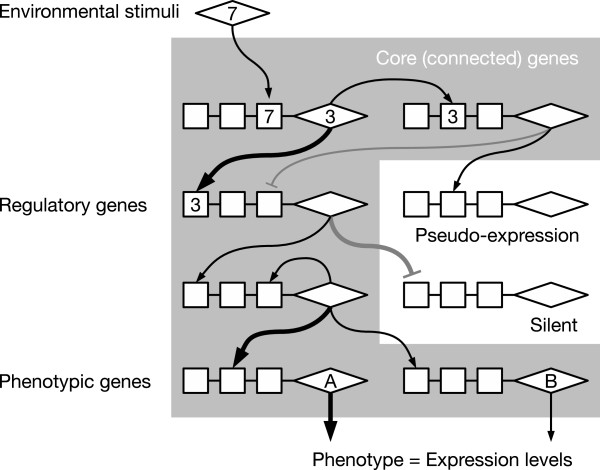
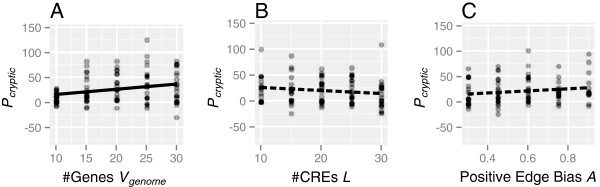
Background: Cryptic genetic variation (CGV) is considered to facilitate phenotypic evolution by producing visible variations in response to changes in the internal and/or external environment. Several mechanisms enabling the accumulation and release of CGVs have been proposed. In this study, we focused on gene regulatory networks (GRNs) as an important mechanism for producing CGVs, and examined how interactions between GRNs and the environment influence the number of CGVs by using individual-based simulations.
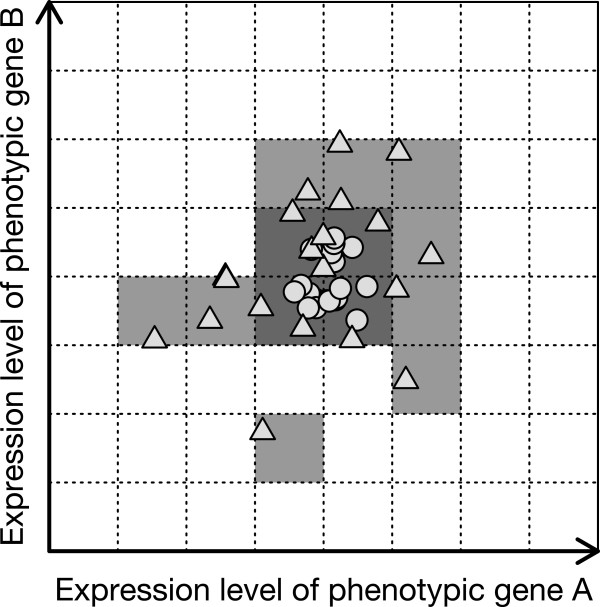
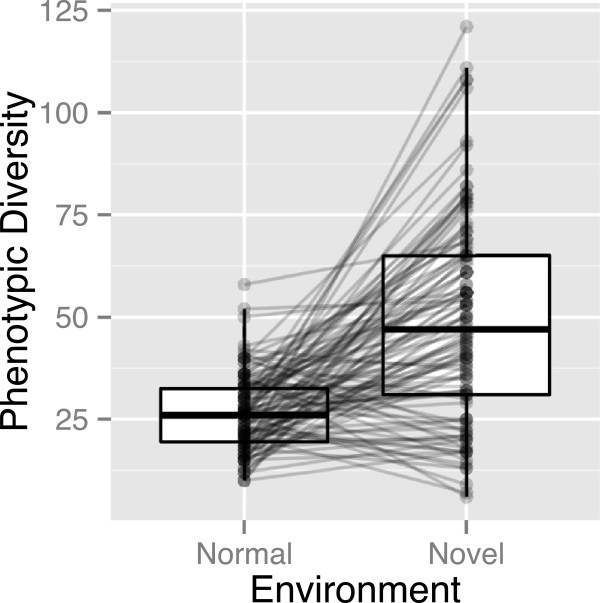
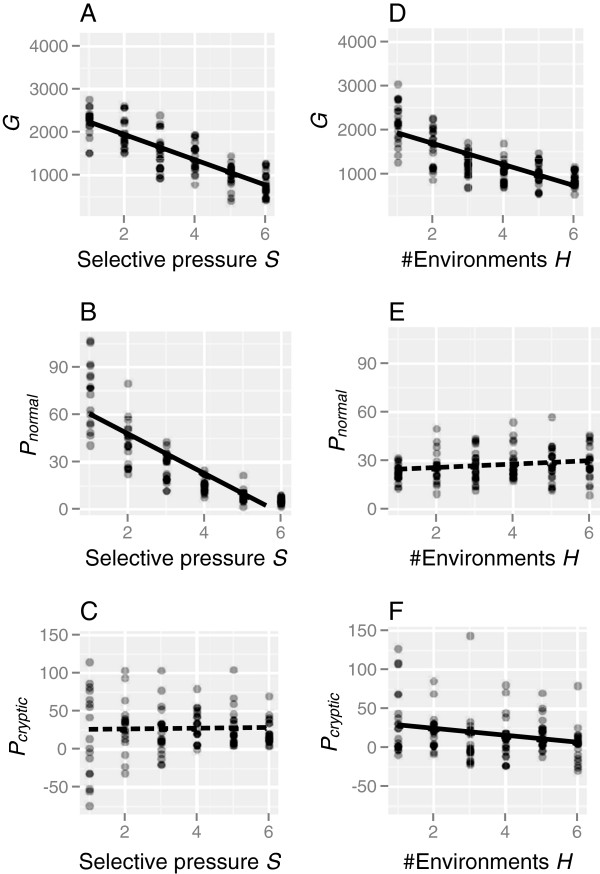
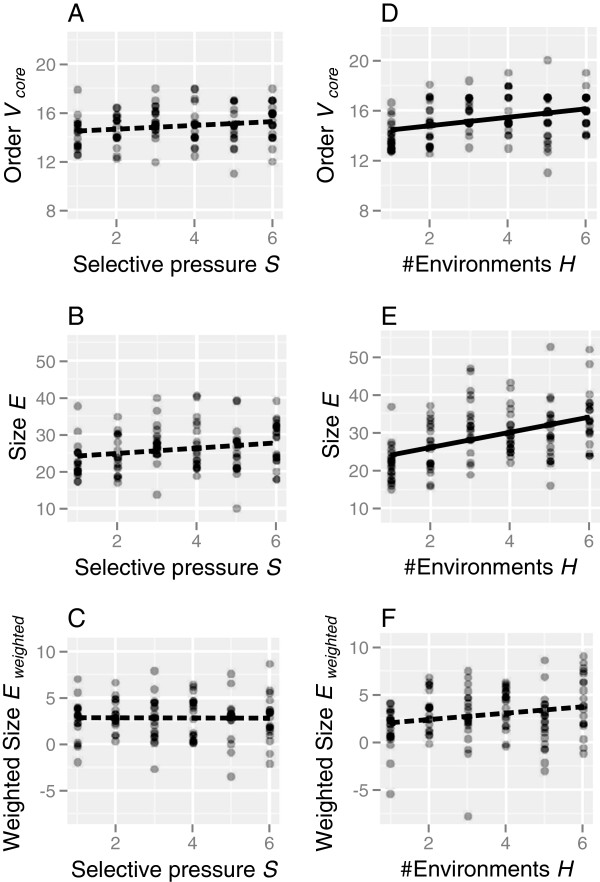
Results: Populations of GRNs were allowed to evolve under various stabilizing selections, and we then measured the number of genetic and phenotypic variations that had arisen. Our results showed that CGVs were not depleted irrespective of the strength of the stabilizing selection for each phenotype, whereas the visible fraction of genetic variation in a population decreased with increasing strength of selection. On the other hand, increasing the number of different environments that individuals encountered within their lifetime (i.e., entailing plastic responses to multiple environments) suppressed the accumulation of CGVs, whereas the GRNs with more genes and interactions were favored in such heterogeneous environments.
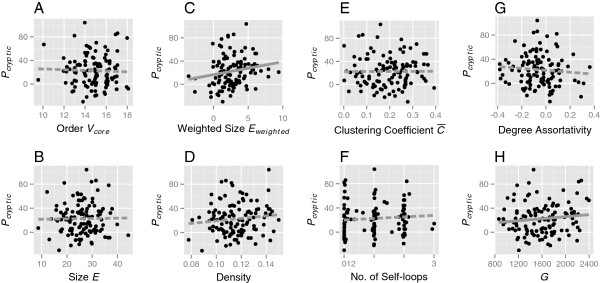
Conclusions: Given the findings that the number of CGVs in a population was largely determined by the size (order) of GRNs, we propose that expansion of GRNs and adaptation to novel environments are mutually facilitating and sustainable sources of evolvability and hence the origins of biological diversity and complexity.
Figures
Similar articles
-
Evolution of gene regulatory networks by fluctuating selection and intrinsic constraints.PLoS Comput Biol. 2010 Aug 5;6(8):e1000873. doi: 10.1371/journal.pcbi.1000873. PLoS Comput Biol. 2010. PMID: 20700492 Free PMC article.
-
Natural selection on crosstalk between gene regulatory networks facilitates bacterial adaptation to novel environments.Curr Opin Microbiol. 2022 Jun;67:102140. doi: 10.1016/j.mib.2022.02.002. Epub 2022 Mar 3. Curr Opin Microbiol. 2022. PMID: 35248980 Review.
-
Replicated evolution of integrated plastic responses during early adaptive divergence.Evolution. 2006 Apr;60(4):801-13. Evolution. 2006. PMID: 16739461
-
Phenotype selection due to mutational robustness.PLoS One. 2024 Nov 18;19(11):e0311058. doi: 10.1371/journal.pone.0311058. eCollection 2024. PLoS One. 2024. PMID: 39556585 Free PMC article.
-
Polygenic Adaptation: Integrating Population Genetics and Gene Regulatory Networks.Trends Genet. 2021 Jul;37(7):631-638. doi: 10.1016/j.tig.2021.03.005. Epub 2021 Apr 21. Trends Genet. 2021. PMID: 33892958 Review.
Cited by
-
On the evolutionary origin of discrete phenotypic plasticity.G3 (Bethesda). 2024 Sep 4;14(9):jkae144. doi: 10.1093/g3journal/jkae144. G3 (Bethesda). 2024. PMID: 38984708 Free PMC article.
-
Co-expression network analysis of environmental canalization in the ascidian Ciona.BMC Ecol Evol. 2022 Apr 28;22(1):53. doi: 10.1186/s12862-022-02006-9. BMC Ecol Evol. 2022. PMID: 35484499 Free PMC article.
-
Contribution of trans regulatory eQTL to cryptic genetic variation in C. elegans.BMC Genomics. 2017 Jun 29;18(1):500. doi: 10.1186/s12864-017-3899-8. BMC Genomics. 2017. PMID: 28662696 Free PMC article.
References
Publication types
MeSH terms
LinkOut - more resources
Full Text Sources
Other Literature Sources
