. 2013 Apr 24;78(2):269-84.
doi: 10.1016/j.neuron.2013.02.012.

Pax6 exerts regional control of cortical progenitor proliferation via direct repression of Cdk6 and hypophosphorylation of pRb

Affiliations

Pax6 exerts regional control of cortical progenitor proliferation via direct repression of Cdk6 and hypophosphorylation of pRb

Da Mi et al. Neuron. .

Abstract

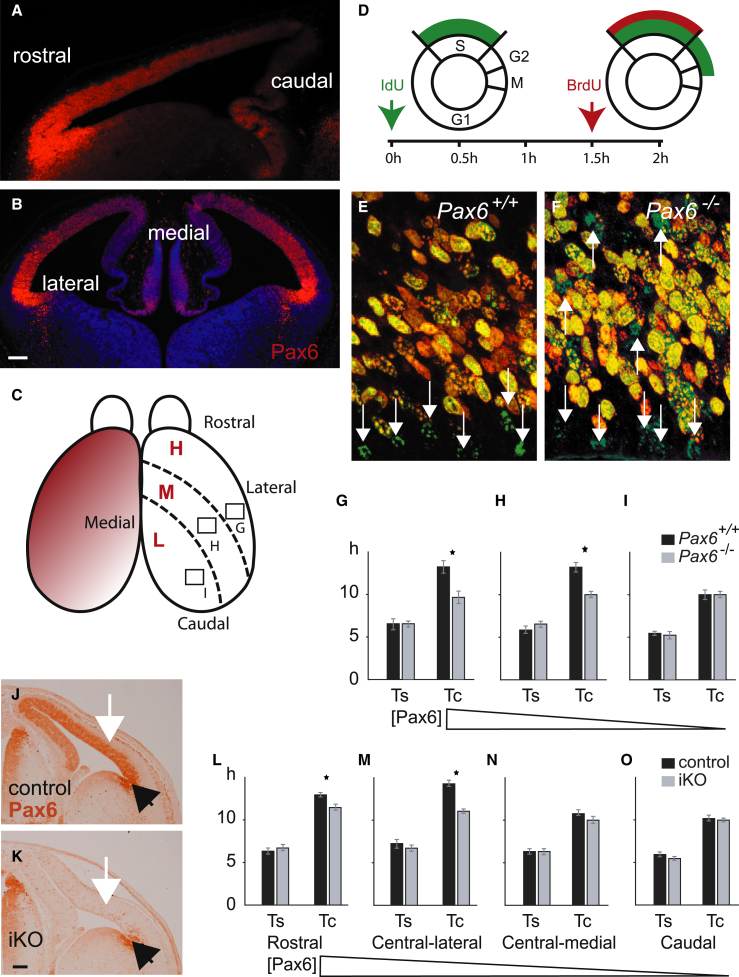
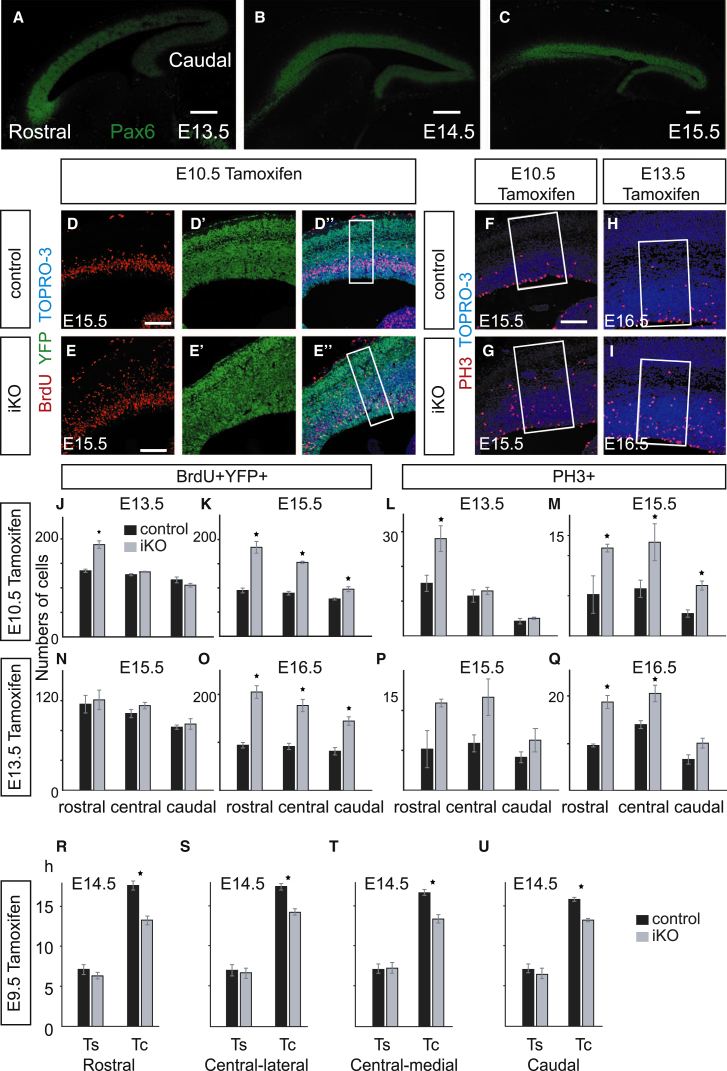
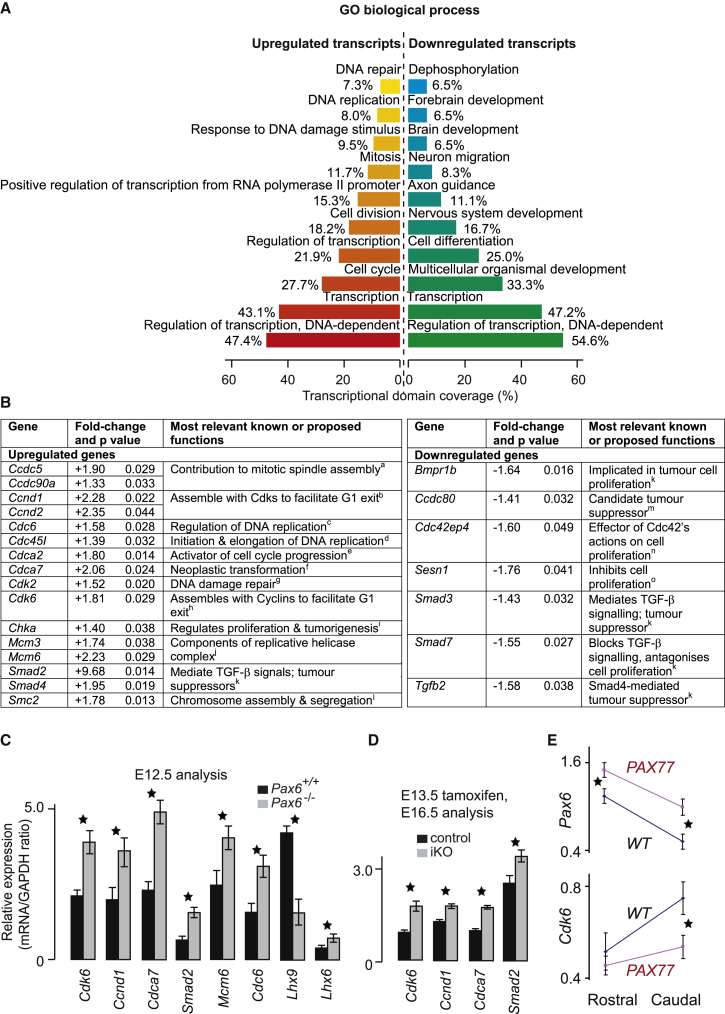
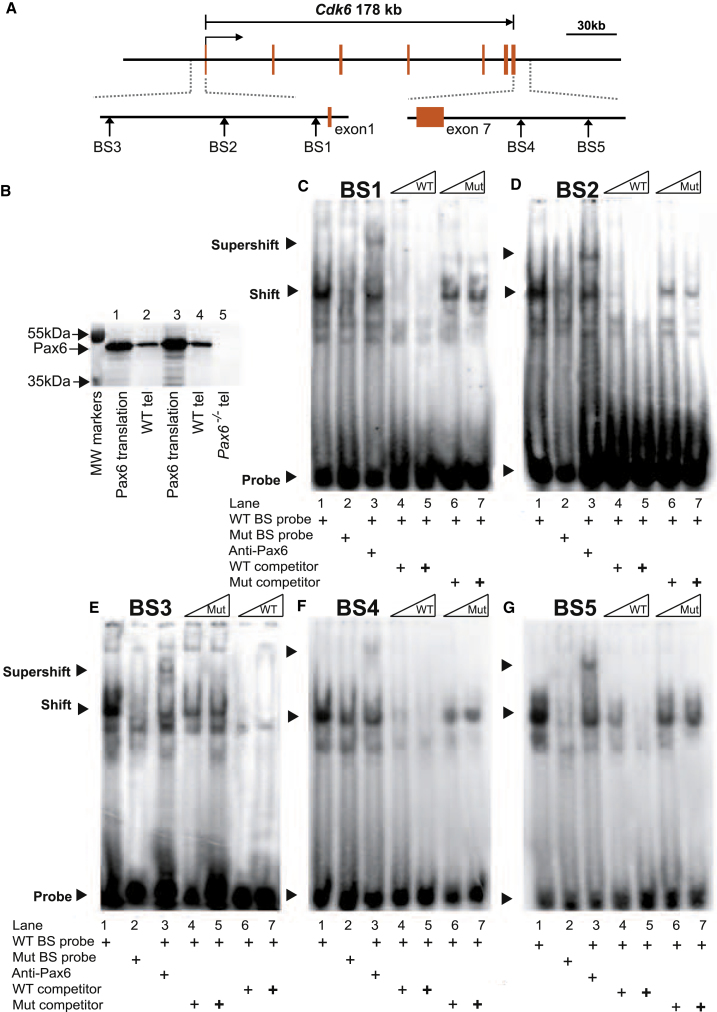
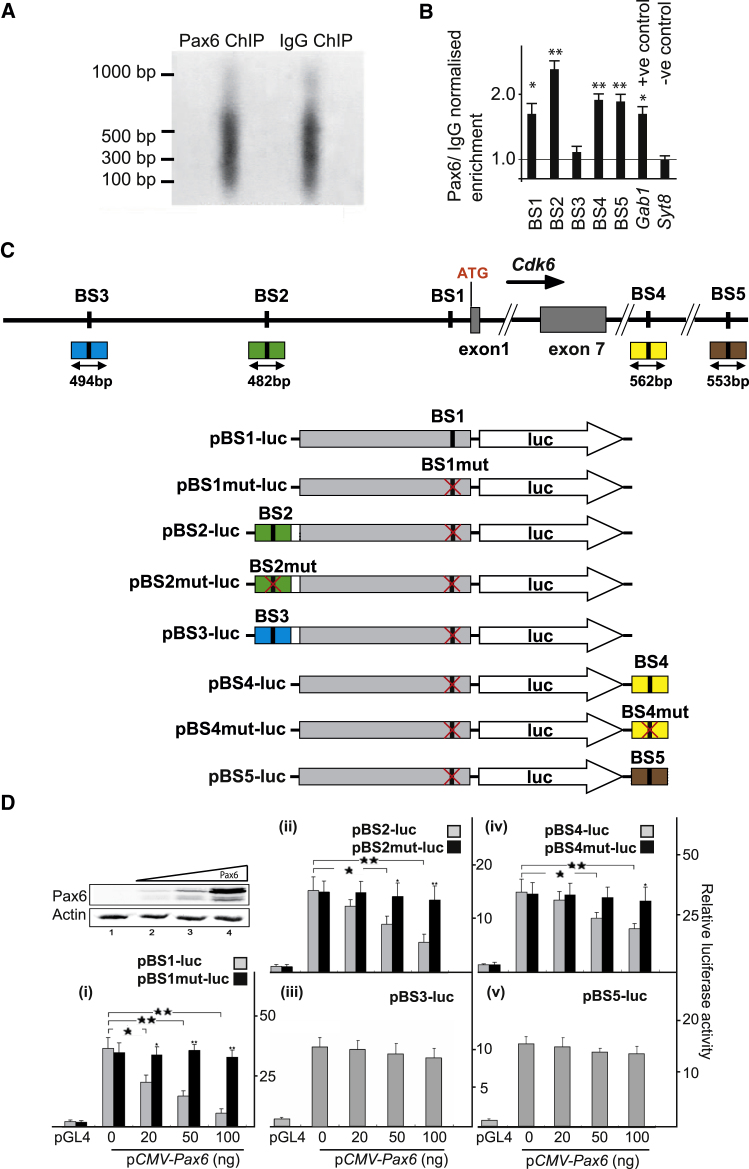
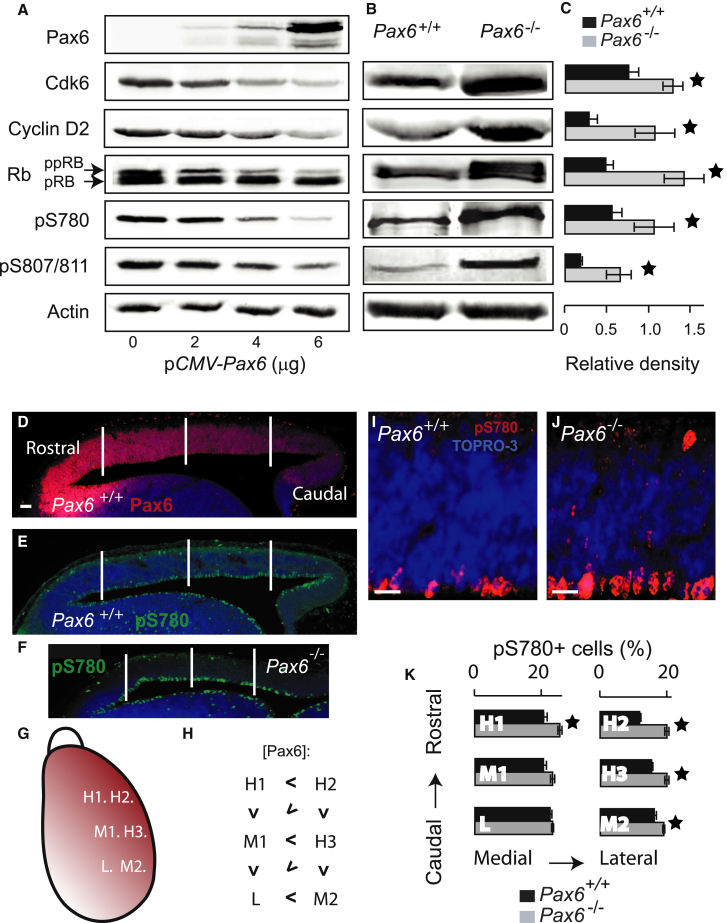
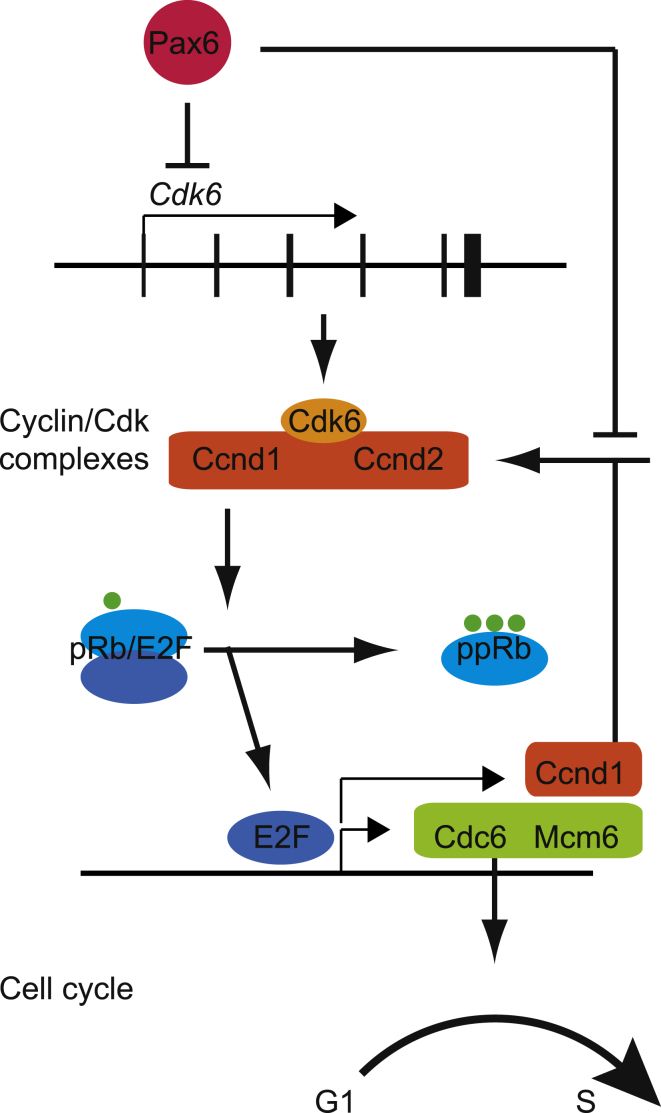
The mechanisms by which early spatiotemporal expression patterns of transcription factors such as Pax6 regulate cortical progenitors in a region-specific manner are poorly understood. Pax6 is expressed in a gradient across the developing cortex and is essential for normal corticogenesis. We found that constitutive or conditional loss of Pax6 increases cortical progenitor proliferation by amounts that vary regionally with normal Pax6 levels. We compared the gene expression profiles of equivalent Pax6-expressing progenitors isolated from Pax6⁺/⁺ and Pax6⁻/⁻ cortices and identified many negatively regulated cell-cycle genes, including Cyclins and Cdks. Biochemical assays indicated that Pax6 directly represses Cdk6 expression. Cyclin/Cdk repression inhibits retinoblastoma protein (pRb) phosphorylation, thereby limiting the transcription of genes that directly promote the mechanics of the cell cycle, and we found that Pax6 inhibits pRb phosphorylation and represses genes involved in DNA replication. Our results indicate that Pax6's modulation of cortical progenitor cell cycles is regional and direct.


Figures

Figure 1
Figure 1
Absence of Pax6 Causes Cell-Cycle Acceleration in Cortical Areas that Normally Express Most Pax6 at E12.5 (A–C) Pax6 protein (red) is normally expressed in a highrostrolateral to lowcaudomedial gradient at E12.5. For analysis of cell-cycle times in Pax6−/− mutants, measurements were made in three zones (G, central-lateral; H, central-medial; I, caudal), expressing high (H), medium (M), or low (L) levels of Pax6, respectively. Scale bars represent 100 μm (A and B). (D) Cell-cycle times at E12.5 were calculated as in Martynoga et al. (2005) from counts of labeled cells obtained by injecting pregnant dams with IdU followed 1.5 hr later by BrdU. (E and F) Examples of cells from Pax6+/+ and Pax6−/− embryos labeled with IdU alone (green; white arrows) or with both BrdU (red) and IdU. In area G in (C) there are more labeled cells in total and more single-IdU-labeled cells in mutants. (G–I) Means (±SEM) for lengths of S phase (Ts) and the overall cell cycle (Tc) in each of the three areas marked in (C) in Pax6+/+ and Pax6−/− embryos. (G) n = 4 embryos per genotype, p < 0.03, Student’s t test. n = 3 (H and I), p < 0.05. (J and K) Loss of Pax6 protein from E12.5 cortex (white arrows) induced by tamoxifen given at E9.5 to Pax6loxP/loxP; Emx1-CreERT2 (iKO) embryos. Note the retention of Pax6 in the ventral pallium (black arrows), where Emx1 is not expressed (scale bar, 100 μm). (L–O) Mean Ts and Tc (±SEM; calculated as in D–F) in iKOs (as in J and K) in four regions of the cortex with progressively lower Pax6 levels (n = 3 embryos per genotype, p < 0.0001, Sidak’s multiple-comparisons test). See also Figure S1.
Figure 2
Figure 2
Loss of Pax6 Causes Increasingly Widespread Rapid-Onset Proliferative Defects after E13.5 (A–C) Expression of Pax6 protein in parasagittal sections from E13.5–E15.5 WT embryos (all oriented the same way; scale bars, 100 μm). (D–E″) BrdU and YFP immunohistochemistry on brain sections from E15.5 iKO and control embryos after tamoxifen administration on E10.5. (D and E) More BrdU-labeled cells were present in iKO cortex. (D′ and E′) Almost all cortical cells were YFP positive. (D″ and E″) Merged images: BrdU-positive cells were counted in radially arranged 100-μm-wide boxes, as illustrated. (F–I) PH3 immunohistochemistry on sections from E15.5 and E16.5 iKO and control embryos after tamoxifen administration on E10.5 or E13.5. Increased numbers of PH3-positive cells were observed in iKOs. PH3-positive cells were counted in 200-μm-wide boxes, as illustrated. Scale bars = 100 μm. (J–Q) Average numbers (±SEM) of BrdU-YFP double-labeled cells or nonapical PH3-labeled cells in counting boxes (see D”, E”, and F–I) from rostral, central, and caudal cortical areas in E13.5, E15.5, or E16.5 iKO or control embryos injected with tamoxifen on E10.5 or E13.5. (J) p < 0.003, Student’s t test. (K) p < 0.002 rostrally, p < 0.001 centrally, p < 0.02 caudally. (L) p < 0.04. (M) p < 0.001 rostrally, p < 0.002 centrally, p < 0.001 caudally. (O) p < 0.002 rostrally, p < 0.004 centrally, p < 0.006 caudally. (Q) p < 0.003 rostrally, p < 0.03 centrally. In all cases, n = 3 embryos per genotype. (R–U) Measurements of mean Ts and Tc (±SEM) in four cortical areas in control and iKO E14.5 embryos after tamoxifen administration at E9.5 (n = 3 embryos per genotype; p < 0.0001, Sidak’s multiple-comparisons test). See also Figures S2 and S3.
Figure 3
Figure 3
Loss of Pax6 Results in Numerous Changes in Expression of Cell-Cycle Genes (A) The top ten overrepresented biological processes identified by GO analysis of all genes with a significant (p < 0.05) increase or decrease in expression. Transcriptional domain coverage is the number of transcripts in each significantly overrepresented theme expressed as a percentage of all transcripts annotated by at least one significantly overrepresented theme. (B) Cell-cycle genes whose expression levels were significantly changed in the absence of Pax6 (aEinarson et al., 2004; bSherr, 1995; cKnockleby and Lee, 2010; dTomita et al., 2011; eRyu et al., 2007; fGoto et al., 2006; gSatyanarayana and Kaldis, 2009; hTashiro et al., 2007; iMiyake and Parsons, 2012; jBochman and Schwacha, 2009; kMeulmeester and Ten Dijke, 2011; lLosada and Hirano, 2005; mBommer et al., 2005; nStengel and Zheng, 2011; oBudanov and Karin, 2008). The p values were obtained after adjustment (Benjamini and Hochberg, 1995). (C and D) qRT-PCR comparing the effects of Pax6 absence (C) or conditional loss (D) on the cortical expression of a set of genes found to have altered expression in our microarray analysis. All differences are significant (means ± SEM; Student’s t test, p < 0.05, n > 3 embryos per genotype in all cases). (E) qRT-PCR comparing the mean levels of Pax6 and Cdk6 (±SEM; n = 4 embryos of each genotype) in the rostral and caudal thirds of E12.5 cortex from WT and PAX77 (Pax6 overexpressing) embryos. Pax6 rostrally: p < 0.001, caudally p < 0.0001; Cdk6: p < 0.0016 (Sidak’s multiple-comparisons test). See also Figures S4, S5, and Table S1.
Figure 4
Figure 4
EMSAs Show that Pax6 Can Bind to Predicted Binding Sites (BS1–BS5) at the Cdk6 Locus (A) Map of the five binding sites (BS1–BS5) at the Cdk6 locus (sequences in Figure S6A). (B) Western blot analysis of Pax6 protein expressed by the TNT In Vitro Transcription/Translation System. Lanes were loaded with 2 μl (lane 1) and 4 μl (lane 3) of in vitro-translated Pax6 protein, 20 μg (lane 2) and 40 μg (lane 4) of Pax6+/+ telencephalic protein, or 40 μg of Pax6−/− telencephalic protein (lane 5). (C–G) EMSAs. Arrowheads indicate free probe (Probe) at the bottom of each gel (probe is WT in lanes 1 and 3–7, and mutant (Mut) in lane 2), probe-protein complexes (Shift), and probe-protein-antibody complexes (Supershift). In all cases, a specific gel shift by binding of Pax6 to potential Pax6 binding sites was clearly detected (lane 1) and was greatly reduced or abolished by mutation of the Pax6 binding sites (lane 2). Binding specificity was confirmed by preincubation with anti-Pax6 antibody, resulting in supershifted complexes (lane 3). Visible shifts were diminished or abolished (in a dose-dependent manner in most cases) by addition of excess nonradiolabeled WT probes to compete with radiolabeled probes, whereas excess amounts of nonradiolabeled mutant probes competed much less effectively (lanes 4–7). See also Figure S6A.
Figure 5
Figure 5
Evidence that Sites around the Cdk6 Gene Bind Pax6 In Vivo and Repress Gene Expression In Vitro (A) Sonication of cortical chromatin gave mainly 100–600 bp genomic fragments for ChIP with antibodies against either Pax6 (experiment) or IgG (control). (B) Results of qChIP on DNA from E12.5 dorsal telencephalon using anti-Pax6 and anti-IgG antibodies followed by qPCR to test for enrichment of each putative Pax6 binding site. For each binding site, the amount of qPCR product obtained with anti-Pax6 antibody was first expressed relative to that obtained with anti-IgG antibody. The resulting ratio was expressed relative to the average ratio obtained with primers for a sequence from the Syt8 gene that does not bind Pax6 (which was set to 1.0; Sansom et al., 2009). A Gab1 sequence known to bind Pax6 (Sansom et al., 2009) was used as a positive control. Means ± SEM (n = 3); < 0.05 and ∗∗p < 0.01 (Student’s t test). (C) Constructs made to test BS1–BS3 located 5′ to exon 1, and BS4 and BS5 located 3′ to exon 7. The position of each binding site is indicated in the schematic drawing, and the size and position of the fragments that were used to generate the constructs are indicated directly beneath. Black vertical bars in the plasmid schematics denote WT binding sites and mutant sites are indicated by red crosses. (D) Results obtained using these constructs to measure firefly luciferase activity (relative to a Renilla luciferase control) in HEK293 cells made to express a range of levels of Pax6 using a CMV-Pax6 construct added at 0, 20, 50, or 100 ng per transfection (the western blot shows Pax6 expression resulting from increasing doses, with actin levels monitored as a loading control). Data labeled pGL4 are from the promoterless vector used to make the constructs with no added inserts as negative controls. All eight constructs induced significant luciferase activity in the absence of Pax6. Data are from three independent experiments. Means ± SEM (n = 3); p < 0.05 and ∗∗p < 0.01 (Sidak’s multiple-comparisons test). See also Figure S6B and Tables S2 and S3.
Figure 6
Figure 6
Pax6 Suppresses Hyperphosphorylation of pRb (A) Western blots showing that transient transfection of HEK293 cells with increasing amounts of Pax6 expression plasmid pCMV-Pax6 resulted in increasing levels of Pax6 and decreasing levels of Cdk6, cyclin D2, the hyperphosphorylated form of pRb (ppRB), pRb phosphorylated at serine 780 (pS780), and pRb phosphorylated at serine 807/811 (pS807/811). Similar results were obtained in three independent experiments. (B) Western blots on protein extracted from E12.5 cortices showing increased levels of Cdk6, cyclin D2, ppRb, pS780, and pS807/811 in the absence of Pax6. (C) Densitometry on bands representing Cdk6, cyclin D2, pRb, pS780, and pS807/811 from western blots such as those in (B). For each protein extract, values were normalized to the β-actin level in that sample. Means ± SEM; p < 0.05, Student’s t test; n = 3 independent experiments in each case. (D–F) Immunohistochemistry showing expression of pS780 and Pax6 in parasagittal sections of E12.5 Pax6+/+ and Pax6−/− cortex. Vertical lines mark the rostrocaudal levels of the quantifications in (G), (H), and (K); counts were in 150 μm × 30 μm areas oriented along the ventricular surface. Scale bar, 100 μm. (G–K) Quantification of the percentages of pS780+ cells in three cortical areas expressing relatively high (H1–H3), medium (M1 and M2), and low (L) levels of Pax6 in two rostral-to-caudal rows of sampling areas (one row medial to the other, laid out as illustrated on a dorsal view of the right hemisphere in (G). The relationships between the relative levels of Pax6 in each position [<] are summarized in (H). (I and J) Rostrolateral sections of cortex from E12.5 Pax6+/+ and Pax6−/− embryos immunoreacted for pS780. Scale bars, 25 μm. (K) Means ± SEM; p < 0.05, Student’s t test; n = 9 embryos of each genotype. See also Figure S7.
Figure 7
Figure 7
A Pathway by which Pax6 Regulates Cortical Progenitor Cell Cycles In this model, Pax6 directly represses Cdk6 expression and, either directly or indirectly, the expression of other cyclins (Ccnds)/Cdks. This limits the hyperphosphorylation of pRb, which is catalyzed by cyclin/Cdk complexes. This limits the release of E2F transcription factors, which bind to pRb. This limits the expression of genes such as Cdc6 and Mcm6, which promote G1 to S phase transition, and Ccnd1 (Cyclin D1), thereby dampening a positive feedback loop that would promote proliferation.

Similar articles

Cited by

References

    1. Appolloni I., Calzolari F., Barilari M., Terrile M., Daga A., Malatesta P. Antagonistic modulation of gliomagenesis by Pax6 and Olig2 in PDGF-induced oligodendroglioma. Int. J. Cancer. 2012;131:E1078–E1087. - PubMed
    1. Asami M., Pilz G.A., Ninkovic J., Godinho L., Schroeder T., Huttner W.B., Götz M. The role of Pax6 in regulating the orientation and mode of cell division of progenitors in the mouse cerebral cortex. Development. 2011;138:5067–5078. - PubMed
    1. Benjamini Y., Hochberg Y. Controlling the false discovery rate: a practical and powerful approach to multiple testing. J. R. Stat. Soc. Ser. B. 1995;57:289–300.
    1. Biggin M.D. Animal transcription networks as highly connected, quantitative continua. Dev. Cell. 2011;21:611–626. - PubMed
    1. Bishop K.M., Goudreau G., O’Leary D.D. Regulation of area identity in the mammalian neocortex by Emx2 and Pax6. Science. 2000;288:344–349. - PubMed

Publication types

MeSH terms