

Changes in hospital mortality for United States intensive care unit admissions from 1988 to 2012
- PMID: 23622086
- PMCID: PMC4057290
- DOI: 10.1186/cc12695
Changes in hospital mortality for United States intensive care unit admissions from 1988 to 2012
Abstract
Introduction: A decrease in disease-specific mortality over the last twenty years has been reported for patients admitted to United States (US) hospitals, but data for intensive care patients are lacking. The aim of this study was to describe changes in hospital mortality and case-mix using clinical data for patients admitted to multiple US ICUs over the last 24 years.
Methods: We carried out a retrospective time series analysis of hospital mortality using clinical data collected from 1988 to 2012. We also examined the impact of ICU admission diagnosis and other clinical characteristics on mortality over time. The potential impact of hospital discharge destination on mortality was also assessed using data from 2001 to 2012.
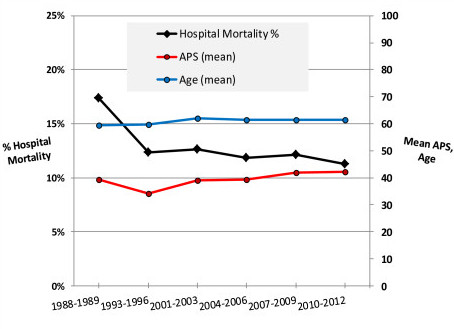
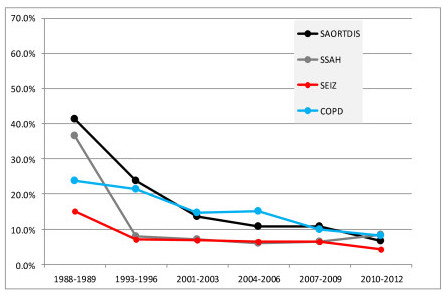
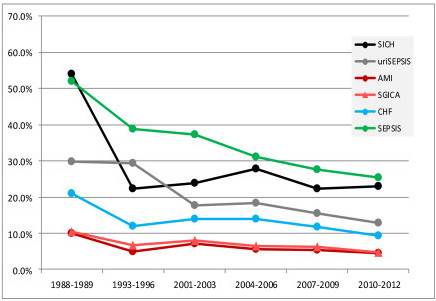
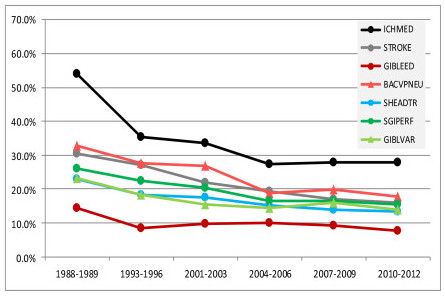
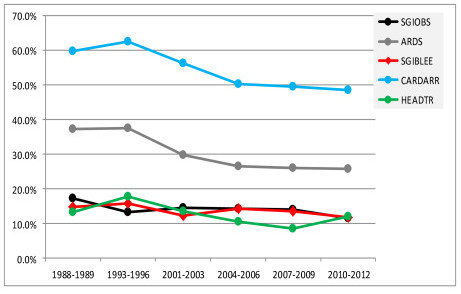
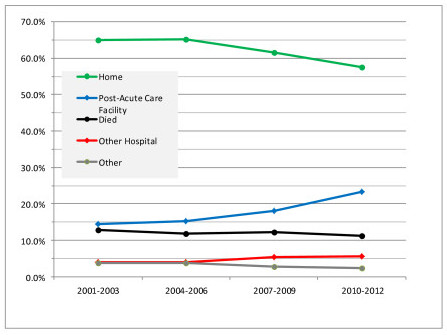
Results: For 482,601 ICU admissions there was a 35% relative decrease in mortality from 1988 to 2012 despite an increase in age and severity of illness. This decrease varied greatly by diagnosis. Mortality fell by >60% for patients with chronic obstructive pulmonary disease, seizures and surgery for aortic dissection and subarachnoid hemorrhage. Mortality fell by 51% to 59% for six diagnoses, 41% to 50% for seven diagnoses, and 10% to 40% for seven diagnoses. The decrease in mortality from 2001 to 2012 was accompanied by an increase in discharge to post-acute care facilities and a decrease in discharge to home.
Conclusions: Hospital mortality for patients admitted to US ICUs has decreased significantly over the past two decades despite an increase in the severity of illness. Decreases in mortality were diagnosis specific and appear attributable to improvements in the quality of care, but changes in discharge destination and other confounders may also be responsible.
Figures
References
-
- Andrews RM, Russo CA, Pancholi M. HCUP Statistical Brief #38. Agency for Healthcare Research and Quality; Rockville, MD; 2007. Trends in hospital risk-adjusted mortality for select diagnoses and procedures, 1994-2004; pp. 1–7. - PubMed
-
- Hines A, Stranges E, Andrews R. HCUP Statistical Brief #98. Agency for Healthcare Research and Quality, Rockville, MD; 2010. Trends in hospital risk-adjusted mortality for select diagnoses by patient subgroups, 2000-2007; pp. 1–11. - PubMed
-
- Bueno H, Ross JS, Wang Y, Chen J, Vidan MT, Normand SLT, Curtis JP, Drye EE, Lichtman JH, Keenan PS, Kosiborod M, Krumholz HM. Trends in length of stay and short-term outcomes among Medicare patients hospitalized for heart failure: 1993-2008. JAMA. 2010;17:2141–2147. doi: 10.1001/jama.2010.748. - DOI - PMC - PubMed
Publication types
MeSH terms
LinkOut - more resources
Full Text Sources
Other Literature Sources
Medical
Miscellaneous
