. 2013 Apr 25;153(3):550-61.
doi: 10.1016/j.cell.2013.03.023.

Specified neural progenitors sort to form sharp domains after noisy Shh signaling

Affiliations

Specified neural progenitors sort to form sharp domains after noisy Shh signaling

Fengzhu Xiong et al. Cell. .

Abstract

Sharply delineated domains of cell types arise in developing tissues under instruction of inductive signal (morphogen) gradients, which specify distinct cell fates at different signal levels. The translation of a morphogen gradient into discrete spatial domains relies on precise signal responses at stable cell positions. However, cells in developing tissues undergoing morphogenesis and proliferation often experience complex movements, which may affect their morphogen exposure, specification, and positioning. How is a clear pattern achieved with cells moving around? Using in toto imaging of the zebrafish neural tube, we analyzed specification patterns and movement trajectories of neural progenitors. We found that specified progenitors of different fates are spatially mixed following heterogeneous Sonic Hedgehog signaling responses. Cell sorting then rearranges them into sharply bordered domains. Ectopically induced motor neuron progenitors also robustly sort to correct locations. Our results reveal that cell sorting acts to correct imprecision of spatial patterning by noisy inductive signals.


Figures

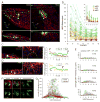
Figure 1
Figure 1. In toto imaging captures dynamics of neural progenitors during neural tube formation in zebrafish embryos
(A) Schematic illustration of imaging set-up. See also Extended Experimental Procedures. (B) Sample time points of raw data rendered in 3D projection dorsal view. Red: mem-citrine, Blue: h2b-cherry, Green: mnx1:gfp. Arrow: the frontier of epiboly movement. Arrowheads: differentiating motorneurons (MNs). All time annotations are hours (and minutes) post fertilization (hpf). All scale bars: 10μm. See also Movie S1. (C) Processed data by GoFigure2 and ACME (Mosaliganti et al, 2012) software from images in B. Top halves: membrane segmentations (random colors to distinguish neighbors); Bottom halves: nuclei segmentations for cell tracking (Red: medial floor plate (MFPs). Orange: lateral floor plate (LFPs). Green: motorneuron progenitors (pMNs). Yellow: unidentified cells). (D) Schematic illustration of cell tracking analysis. Drawings are based on cross-section images, colors are assigned based on marker expression (Red: Shh, Yellow: nkx2.2a, Green: mnx1, Blue: gata2). Part of the notochord (NC, Shh+) is included. (i). Morphogenesis during the patterning process, single cells can be tracked throughout (e.g. highlighted cell with red membrane). Tracks carry information of reporter expression (ii), lineage relationships (iii) and movement trajectories (iv). See also Figure S1A. (E) Cross-sectional view (Dorsal side up) of sample dataset. Red: nuclei. A GFP+ “stripe” domain emerges (bracket, bottom left image). Arrow: Differentiating MNs exiting the GFP domain. See also Movie S2. (F) Relative speed of cell movement during neural tube formation. Each purple mark represents the speed of a single cell, 41 tracked ventral cells are plotted. Relative speed is calculated by dividing a cell’s positional change (μm) between 2 time points over the time difference (11.5 minutes). Position is measured relative to the average position of all tracked cells to eliminate global movements introduced by embryo rotation/shifting. Orange marks: average speed. See also Figure S1F.
Figure 2
Figure 2. Shape changes of Shh gradient and heterogeneity in spatial distribution of responses
(A) Time course of notochord formation by shh:gfp+ cells in cross-section. Red: mem-mCherry (same below). Arrowhead: GFP+ cells in neural ectoderm/plate. Arrow: MFP cell expressing GFP. All scale bars: 10μm. (B) Cross-section (i, iii) and longitudinal-section (ii, iv) of ptch2:kaede expression pattern. Arrowheads: Neighbor cells with different Kaede levels. Asterisks: Stereotypic cell fates at the indicated locations. See also Figure S1A. (C,C′) Kaede level spatial distribution through time. Each mark represents a segmented cell with measured position and fluorescence intensity. C’: spatially averaged (±s.d.) representation of C. Kaede intensities in the notochord cells were subtracted as background.
Figure 3
Figure 3. Progenitor fates are specified during cell movements in mixed distributions
(A) Time course of mnx1:gfp expression. Images are cross-sectional examples. Red arrows: mixed negative cells. White arrows: scattered positive cells. All scale bars: 10μm. (B) GFP (mnx1:gfp) levels in tracked cells through time. See also Figure S3A. (C) Time course of Cyclopamine inhibition of pMN specification. Treatment of 100μM Cyclopamine started at indicated times and MNs were counted at 28hpf as an indicator of pMN number. Numbers are averaged per embryo by number of neural segments counted. Green marks: average (±s.d). See also Figure S3B. (D) olig2:gfp (blue) domain formation. Green: cell membrane. Red: cell nucleus. Filled arrows: scattered positive cells. Empty arrows: mixed negative cells. Dashed lines: notochord boundary. (E) Spatial distribution of olig2:gfp+ cells. At 10hpf they scatter in a wider range and are mixed with negative cells, in contrast, at 14hpf positive cells form a major “stripe” between 15 and 30μm where negative cells are absent. (F) Two models for sharp stripe formation. (i) Late (improved) gradient re-writes responses, predicting late specification and stable positions; (ii) Cell sorting corrects wrong positions, predicting early specification and rearrangement afterwards.
Figure 4
Figure 4. Progenitors share fate but not position with sisters and cousins at early stages
(A) Summary of lineage motif counts (n=83). Counts are collected from 18 independent datasets. Motifs with 2 generations are not often captured in the imaged time window so the count does not suggest that 2-generation motifs happen in lower frequencies than 1-generation motifs. Division times: before 12hpf, n=30, 12–14hpf, n=20, after 14hpf, n=33. See also Figure S4A. (B) Separation dynamics of sister cells after birth. The 0 points: the birth time of sister cells from the division of mother cell. A distance of 6 to 8μm indicates the sisters remain neighbors, 10 to 16μm one cell separation, etc. See also Figure S4B. (C) Cell divisions causing position instability. 50 division events randomly picked through time. 18 divisions happen closely along the LM/DV axis, generating at least one cell-diameter difference (>8μm) in position between sister cells. At later time, more divisions are perpendicular to the LM/DV axis, generating no significant positional difference between sisters (<3μm). See also Figure S4C.
Figure 5
Figure 5. Progenitors enter stable locations and form sharp boundaries by intensive cell rearrangement
(A) Distribution of tracked cells from a fully analyzed ventral neural segment (comprised of 7 MFPs, 13 LFPs and >20 pMNs) at early neural plate stage (i,ii) and neural tube stage (iii,iv). (ii), (iv): Corresponding cross-sectional views of (i), (iii). Green lines indicate the intersection of cross-section view and dorsal view (i, ii and lower line in iii) or the upper boundary of the dataset (iv and upper line in iii). Colored spheres: 3D locations of tracked cells (Red: MFP; Orange: LFP; Green: pMN). Dashed lines: notochord boundary. Small red spheres: notochord top midline. (B) Trajectories of tracked cells along the LM/DV axis demonstrating intensive sorting. For simplicity, only six time points on the tracks are plotted. 66 tracks collected from 4 datasets are plotted. Some cells exhibit rearrangements beyond 16hpf. Insert: population average position ± s.d. (colored bars) of tracks by cell type plotted on the same axes. See also Figure S5A. (C) Example of relative positional changes of a pMN (light green, pMN2a) and a MFP (red, MFP1,1a). Green dashed line: midline. White dashed line: notochord boundary. (iii): Full movement trajectories of the cells (same in D, for simplicity, one of the daughter cell tracks is continued with the mother track). (D) Example of positional switch between a pMN (light green, pMN1a) and a LFP cell (orange, LFP4,4a). See also Movie S5. (E) mnx1:gfp expression boundary formation between LFPs and pMNs. GFP intensity distribution by position plotted for 4 time points. Each mark represents a cell (>200 cells per time point). Colored marks: tracked cells with known fates; Grey marks: other segmented cells at the plotted time point. (F) Cdh2 perturbations on mnx1:gfp+ domain formation. Images are 24hpf cross-sections of mosaic labeled (cherry ±cdh2 Morpholino (MO) and dominant negative Cdh2-cherry fusion (dnCdh2-cherry)) neural tubes. Arrowheads: puncta of dnCdh2-cherry. Scale bar: 10μm. See also Figure S5E, Movie S7. (G) Quantification of GFP+ cell distribution in Cdh2 morphant and control. See also Figure S5E.
Figure 6
Figure 6. Ectopic Mnx2a expressing cells form a sharp ventral domain similar to the pMN domain
(A) 24hpf neural tube phenotypes after injection of mem-mCherry ± mnx2a mRNAs in one blastomere at 8–16 cell stage. Phenotypes are classified according to the distribution of mCherry+ cells (Brackets): class I embryos contain cells only in the ventral 1/3 of the neural tube; class II embryos contain cells in the ventral 2/3; “random” contains injected cells throughout. Green: mnx1:gfp. All scale bars: 10μm. See also Figure S6A. (B) Summary of mosaic injection experiments. Early defect embryos failed to form neurula. Cyclopamine treatment started at 7hpf. (C) Sample time course of Mnx2a domain formation. This Mnx2a embryo became class II type. Dashed line circles: position of the notochord. Green: mnx1:gfp. Red: mem-mCherry. See also Figure S6B. (D) Mnx2a expressing cells replace “normal” pMNs. Imaging and counting of MNs as Figure 3C. p values: *0.09;**0.00004,***0.0001,****0.03 (Student’s t test).
Figure 7
Figure 7. Revised “French Flag” model incorporating dynamics of morphogen gradient and cell sorting
This model depicts specification and sorting sequentially for conceptual clarity but they occur at different and overlapping times for different cells. See Discussion. See also Figure S7.

Comment in

  • Sorting sloppy Sonic.
    Little SC, Gregor T. Little SC, et al. Cell. 2013 Apr 25;153(3):509-10. doi: 10.1016/j.cell.2013.04.021. Cell. 2013. PMID: 23622235 Free PMC article.

Similar articles

Cited by

References

    1. Ahn S, Joyner AL. Dynamic changes in the response of cells to positive hedgehog signaling during mouse limb patterning. Cell. 2004;118:505–516. - PubMed
    1. Balaskas N, Ribeiro A, Panovska J, Dessaud E, Sasai N, Page KM, Briscoe J, Ribes V. Gene regulatory logic for reading the Sonic Hedgehog signaling gradient in the vertebrate neural tube. Cell. 2012;148:273–284. - PMC - PubMed
    1. Catala M, Teillet MA, De Robertis EM, Le Douarin ML. A spinal cord fate map in the avian embryo: while regressing, Hensen’s node lays down the notochord and floor plate thus joining the spinal cord lateral walls. Development. 1996;122:2599–2610. - PubMed
    1. Chamberlain CE, Jeong J, Guo C, Allen BL, McMahon AP. Notochord-derived Shh concentrates in close association with the apically positioned basal body in neural target cells and forms a dynamic gradient during neural patterning. Development. 2008;135:1097–1106. - PubMed
    1. Clarke J. Role of polarized cell divisions in zebrafish neural tube formation. Curr Opin Neurobiol. 2009;19:134–138. - PMC - PubMed

Publication types