. 2013 Apr 25;153(3):562-74.
doi: 10.1016/j.cell.2013.04.005.

MicroRNAs inhibit the translation of target mRNAs on the endoplasmic reticulum in Arabidopsis

Affiliations

MicroRNAs inhibit the translation of target mRNAs on the endoplasmic reticulum in Arabidopsis

Shengben Li et al. Cell. .

Abstract

Translation inhibition is a major but poorly understood mode of action of microRNAs (miRNAs) in plants and animals. In particular, the subcellular location where this process takes place is unknown. Here, we show that the translation inhibition, but not the mRNA cleavage activity, of Arabidopsis miRNAs requires ALTERED MERISTEM PROGRAM1 (AMP1). AMP1 encodes an integral membrane protein associated with endoplasmic reticulum (ER) and ARGONAUTE1, the miRNA effector and a peripheral ER membrane protein. Large differences in polysome association of miRNA target RNAs are found between wild-type and the amp1 mutant for membrane-bound, but not total, polysomes. This, together with AMP1-independent recruitment of miRNA target transcripts to membrane fractions, shows that miRNAs inhibit the translation of target RNAs on the ER. This study demonstrates that translation inhibition is an important activity of plant miRNAs, reveals the subcellular location of this activity, and uncovers a previously unknown function of the ER.


Figures

Figure 1
Figure 1
The amp1-30 mutant exhibits pleiotropic developmental defects. (A) A 12-day-old rdr6-11 seedling with two cotyledons and two true leaves. (B) A 12-day-old rdr6-11 amp1-30 seedling with three pin-shaped cotyledons (marked by arrows) and four true leaves. Abnormal anthocyanin accumulation gives the seedling a purple color. (C) A phb-1d/+ plant. (D) A phb-1d/+amp1-30 plant with trumpet-shaped leaves. (E) An rdr6-11 embryo with a normal suspensor (arrow). (F) An rdr6-11 amp1-30 embryo showing over proliferation of the suspensor (arrow). (G) A cleared rdr6-11 cotyledon showing venation patterns similar to those in wild type. (H) A cleared rdr6-11 amp1-30 cotyledon showing incomplete venation. (I) A dissected rdr6-11 silique showing a full complement of seeds. (J) A dissected rdr6-11 amp1-30 silique with few seeds. Scale bars in (I–J), 3 mm. (K) Five-week-old wild type (left), amp1-30 (middle), and amp1-30 lamp1-1 (right) plants. (L) The AMP1 gene rescues the developmental defects of the amp1-30 mutant. Left, wild type; middle, amp1-30; right, amp1-30AMP1p::AMP1-GFP. See also Table S1 and Figure S1.
Figure 2
Figure 2
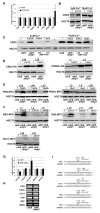
AMP1 is dispensable for miRNA-mediated transcript cleavage, but is required for the activities of miRNAs in repressing the protein levels of target genes. *, P value < 0.05; **, P value < 0.01. (A) Steady-state levels of transcripts from eight miRNA target genes as determined by real-time RT-PCR in three independent experiments. UBQ5 was used as an internal control. (B–F) Western blots to determine the levels of various proteins. HSC70 served as the loading control. One biological replicated is shown; two others are in Fig S2. The numbers above the blots indicate relative protein levels as calculated from the three biological replicates. (B–C) CSD2 protein levels in various genotypes under Cu2+-limiting (miR398 present) and Cu2+-replete (miR398 absent) conditions. L50 and L70 are two independent AMP1p::AMP1-HA transgenic lines in the rdr6 amp1 background. (D) Levels of CSD2-HA or CSD2m-HA from rdr6 and rdr6 amp1 plants carrying a homozygous transgene at the same genomic location. L28 and L32 are two independent transgenic events for CSD2p::CSD2-HA; L4 and L5 are two independent transgenic events for CSD2p::CSD2m-HA. Plants were grown under Cu2+-limiting conditions. (E) Levels of PHB-MYC or PHBm-MYC from rdr6 and rdr6 amp1 plants carrying a homozygous transgene at the same genomic location. L52, L49, and L25 are three independent transgene insertion events for 35S::PHB-MYC; L2, L8, and L26 are three independent transgene insertion events for 35S::PHBm-MYC. (F) Levels of REV-MYC, CNA-MYC, and CUC1-MYC proteins. For each transgene, two to three independent transgene insertion events (as indicated by L followed by a number above the gel images) were evaluated. (G) Real-time RT-PCR to examine transcript levels from various transgenes in (D–F). Values were normalized to UBQ5. Standard deviations were calculated from three independent experiments. (H) Semi-quantitative 5′ RACE-PCR to detect the 3′ fragments generated through miRNA-guided cleavage of various target transcripts. UBQ5 is a loading control. (I) Mapping the position of miRNA-guided cleavage by cloning and sequencing the 5′ RACE products in (H). The miRNAs that target the transcripts are shown. The numbers above the sequences indicate the number of clones representing cleavage at the expected position (arrowhead) out of the total number of clones sequenced. See also Figure S2.
Figure 3
Figure 3
Measurement of protein synthesis from a CSD2p::CSD2-HA transgene in the rdr6 or rdr6 amp1 background. (A, C) Isogenic rdr6CSD2p::CSD2-HA and rdr6 amp1CSD2p::CSD2-HA seedlings (L32 in Fig. 2D) were labeled with 35S-Methionine for 20 or 40 min under Cu2+-limiting (miR398 present) or Cu2+-replete (miR398 absent) conditions. CSD2-HA was then immunoprecipitated, resolved by SDS-PAGE, and transferred to a membrane. The membrane was first subjected to western blotting to detect steady-state levels of CSD2-HA (bottom gel images) and then to autoradiography to detect labeled CSD2-HA (35S-CSD2-HA). Note that the steady-state CSD2-HA levels serve as a loading control. Under Cu2+-limiting conditions, the difference in steady-state CSD2-HA levels between rdr6 and rdr6 amp1 was already known (Fig 2D). By referencing Fig 2D, we conclude that the loading was comparable for rdr6 and rdr6 amp1. Under Cu2+-replete conditions, CSD2-HA steady-state levels should be nearly equal (Fig 2C). Therefore, loading was even for the four samples. (B, D) Quantification of 35S-CSD2-HA signals in (A, C). The rdr6 20 min sample was arbitrarily set to 1.0. The quantification was based on three independent replicates (this Figure and Figure S3). **, P value < 0.01. See also Figure S3.
Figure 4
Figure 4
AMP1 and its paralog LAMP1 have overlapping functions in mediating the translation inhibition activities of miRNAs. (A) Diagrams of AMP1, LAMP1, and three animal AMP1 homologs. The molecular lesions in two amp1 alleles are shown. PA, protease-associated domain; Peptidase_M28, a Pfam peptidase domain; TFR_dimer, a dimerization domain in transferrin receptor. pt is a previously described amp1 allele (Helliwell et al., 2001). (B) The amp1 lamp1 double mutant is extremely dwarfed. Scale bar, 6 mm. (C) Siliques from wild type (Col), amp1, and the amp1 lamp1 double mutant. Scale bar, 6 mm. (D, E) Western blots to determine CSD2 (D) and AGO1 (E) protein levels in wild type (Col), amp1, and amp1 lamp1. Note that the two AGO1 panels cannot be compared with each other due to differences in exposure time. (F) Real-time RT-PCR to determine the transcript levels of eight miRNA target genes and two non-targets (ACTIN8 and eIF4A) in wild type (Col) and amp1 lamp1. Values were normalized to UBQ5. Standard deviations were calculated from three independent experiments. In (D–F), P value < 0.05 (*) or 0.01 (**).
Figure 5
Figure 5
AMP1 and AGO1 are associated in vivo, and both are localized to the ER. (A) Co-IP performed with an AMP1p::AMP1-GFP rdr6 amp1 line, in which the transgene fully rescues the amp1 phenotypes. WT, rdr6 plants without the transgene. IP was performed with anti-GFP antibodies, and the immunoprecipitates were subjected to western blotting with anti-GFP (left panel) or anti-AGO1 (right panel) antibodies. (B) Co-IP performed with an AMP1p::AMP1-HA rdr6 amp1 line, in which the transgene fully rescues the amp1 phenotypes. WT, rdr6 plants without the transgene. IP was conducted with anti-AGO1 antibodies and the immunoprecipitates were subjected to western blotting with anti-AGO1 (left panel) or anti-HA (right panel) antibodies. 1% of lysate was used to extract proteins as input in (A) and (B). (C–H) Co-localization of AMP1-GFP or YFP-AGO1 with ER-mCherry. AMP1-GFP (C–E) or YFP-AGO1 (F–H) was transiently co-expressed with ER-mCherry in N. benthamiana leaves. Fluorescence was observed separately (C and D; F and G), and the images were merged (E, H). (I) Quantification of co-localization between YFP-AGO1 or DCP1-CFP with ER-mCherry. Confocal z-stacks were collected from 30 and 23 cells for YFP-AGO1 and DCP1-CFP, respectively, and co-localization was quantified with the image analysis software IMARIS7.2. (J) AMP1-HA and AGO1 are present in a crude membrane fraction. Western blots were performed to detect various proteins in the total extract, the soluble fraction or the pellet after centrifugation at 100,000g. PEPC and HSC70 are a cytosolic and an ER luminal protein, respectively. (K) AMP1 is an integral membrane protein, whereas AGO1 is a peripheral membrane protein. Western blots were performed to detect the presence of AMP1-GFP and AGO1 in the soluble fraction (S) or the pellet (P) after membrane suspensions in buffers containing high salt or detergent concentrations or high pH were centrifuged at 100,000g. AMP1p::AMP1-GFP rdr6 amp1 plants were used for the assays. (L) A TEM image of a root tip section from an AMP1p::AMP1-HA rdr6 amp1 line immunolabeled with anti-HA antibodies. All immunogold particles are marked by red arrows. White arrowheads indicate ribosome particles on the surface of ER. Most ER tubules in the images are dotted with ribosomes and hence are rough ER. (M) A TEM image of a root tip section from an AMP1p::AMP1-HA rdr6 amp1 line immunolabeled for AMP1-HA (15nm gold particles; white arrows) and Calnexin (10nm gold particles; red arrows). See also Table S2 and Figure S4.
Figure 6
Figure 6
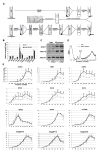
Profiles of membrane-bound polysomes (MBPs) from wild type (Col) and the amp1 lamp1 double mutant, and the distribution of various mRNAs along MBPs. (A) A diagram showing the schemes used for the isolation of total polysomes (TPs) and MBPs. (B) Quantification of various transcripts in the microsome fraction by real-time RT-PCR. Eight miRNA target mRNAs and three non-targets (UBQ5, ACTIN8, and eIF4A) were assayed. The amount of a transcript in the microsome fraction is expressed as a proportion of the total amount for the RNA in the cell. The error bars were calculated from three biological repeats. (C) AMP1 or LAMP1 is not required for the microsome association of AGO1. Western blots were performed to determine the levels of AGO1 in total extract and in the microsome fraction. SEC12 and HSC70 serve as an ER marker and a loading control, respectively. (D) A254 absorption profiles of MBPs. 17 sucrose gradient fractions were collected. (E) Distribution of mRNAs along the sucrose gradients in (D) as determined by real-time RT-PCR. AGO1, PHB, CSD2, SPL3, SCL6, and TCP4 are miRNA target transcripts. UBQ5, eIF4A, ACTIN8, At5g66770, At5g28770, and At2g01570 are non-target transcripts. The amount of a specific mRNA in each of the 17 fractions is expressed as the percentage of the total amount of the RNA in microsomes. Fractions with negligible amounts of transcripts are not shown. The error bars were calculated from three biological replicates. P values < 0.05 (*) or 0.01 (**). See also Figure S5.

Comment in

  • MicroRNAs visit the ER.
    Montgomery TA, Ruvkun G. Montgomery TA, et al. Cell. 2013 Apr 25;153(3):511-2. doi: 10.1016/j.cell.2013.04.014. Cell. 2013. PMID: 23622236

Similar articles

Cited by

References

    1. Aukerman MJ, Sakai H. Regulation of flowering time and floral organ identity by a microRNA and its APETALA2-like target genes. Plant Cell. 2003;15:2730–2741. - PMC - PubMed
    1. Baumberger N, Baulcombe DC. Arabidopsis ARGONAUTE1 is an RNA Slicer that selectively recruits microRNAs and short interfering RNAs. Proc Natl Acad Sci U S A. 2005;102:11928–11933. - PMC - PubMed
    1. Bazzini AA, Lee MT, Giraldez AJ. Ribosome profiling shows that miR-430 reduces translation before causing mRNA decay in zebrafish. Science. 2012;336:233–237. - PMC - PubMed
    1. Birckbichler PJ, Pryme IF. Fractionation of membrane-bound polysomes, free polysomes, and nuclei from tissue-cultured cells. Eur J Biochem. 1978;33:368–373. - PubMed
    1. Brodersen P, Sakvarelidze-Achard L, Bruun-Rasmussen M, Dunoyer P, Yamamoto YY, Sieburth L, Voinnet O. Widespread translational inhibition by plant miRNAs and siRNAs. Science. 2008;320:1185–1190. - PubMed

Publication types