. 2013 Apr 25;153(3):575-89.
doi: 10.1016/j.cell.2013.03.024.

ADAR1 forms a complex with Dicer to promote microRNA processing and RNA-induced gene silencing

Affiliations

ADAR1 forms a complex with Dicer to promote microRNA processing and RNA-induced gene silencing

Hiromitsu Ota et al. Cell. .

Abstract

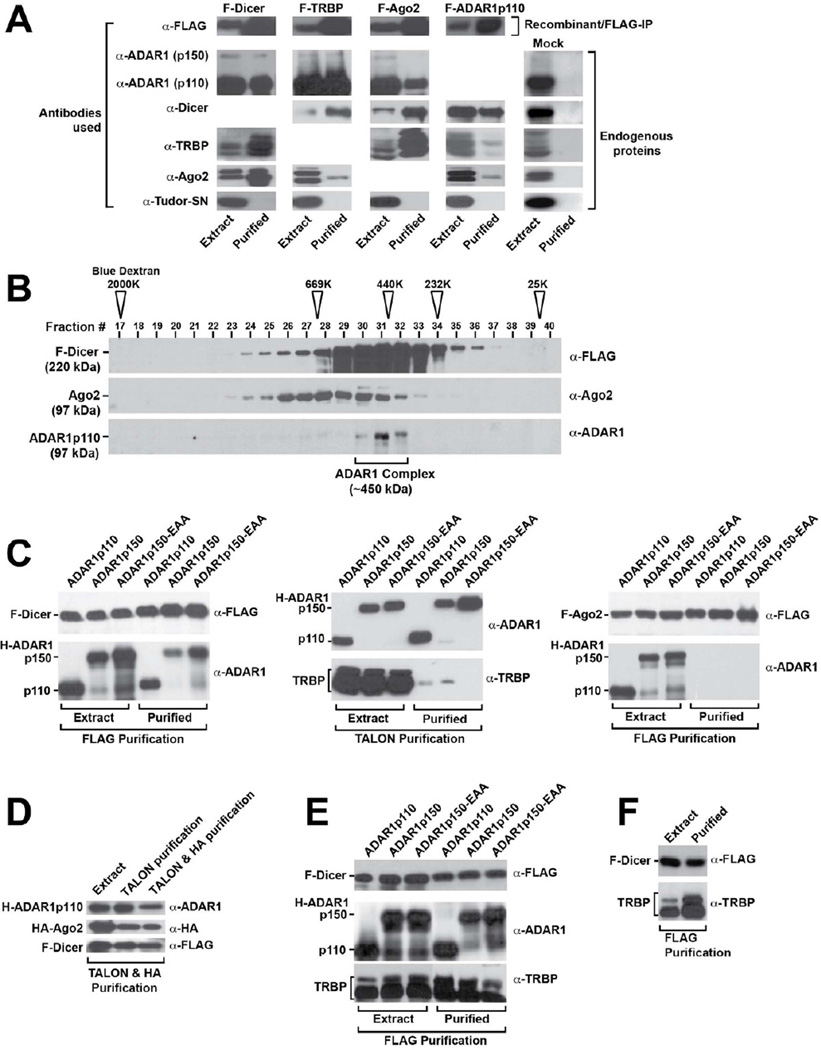
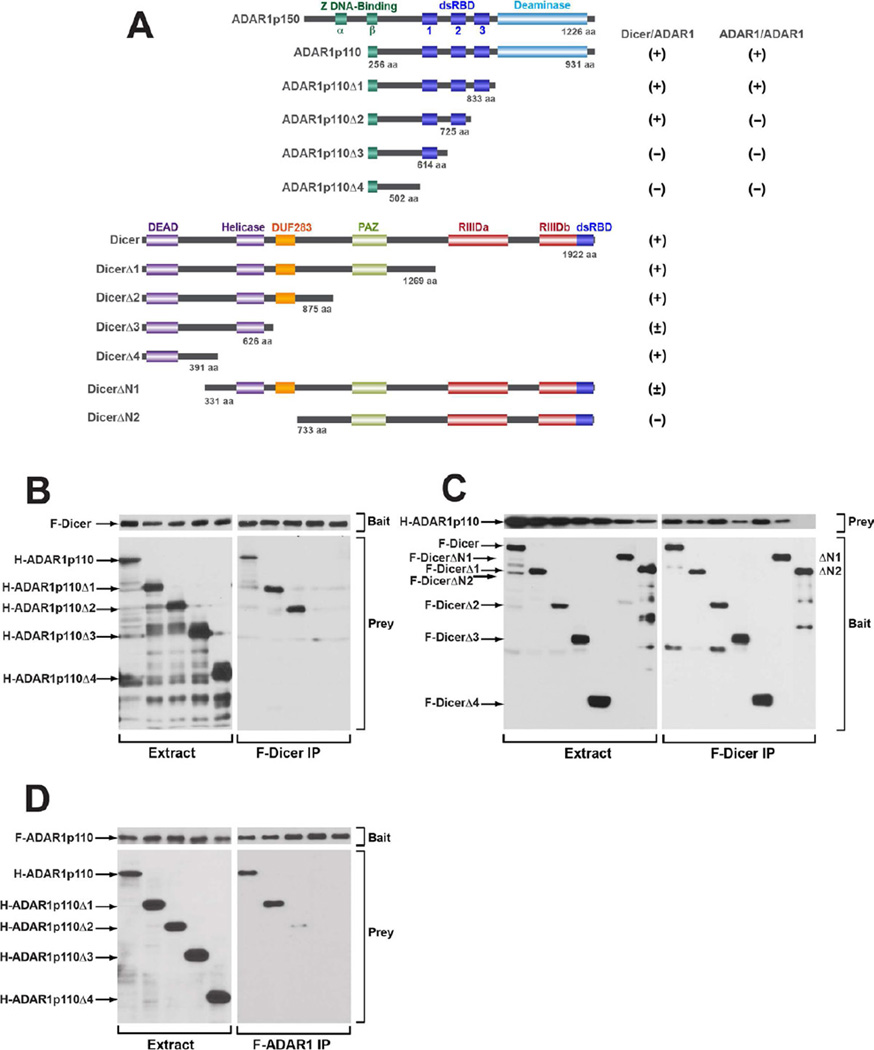
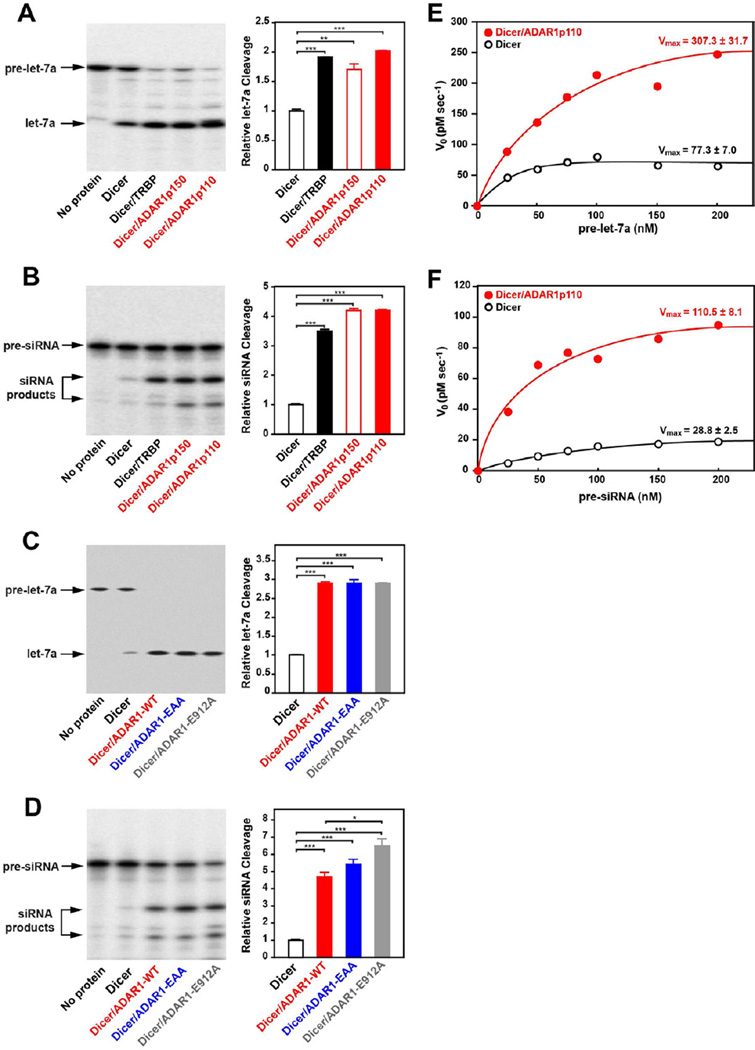
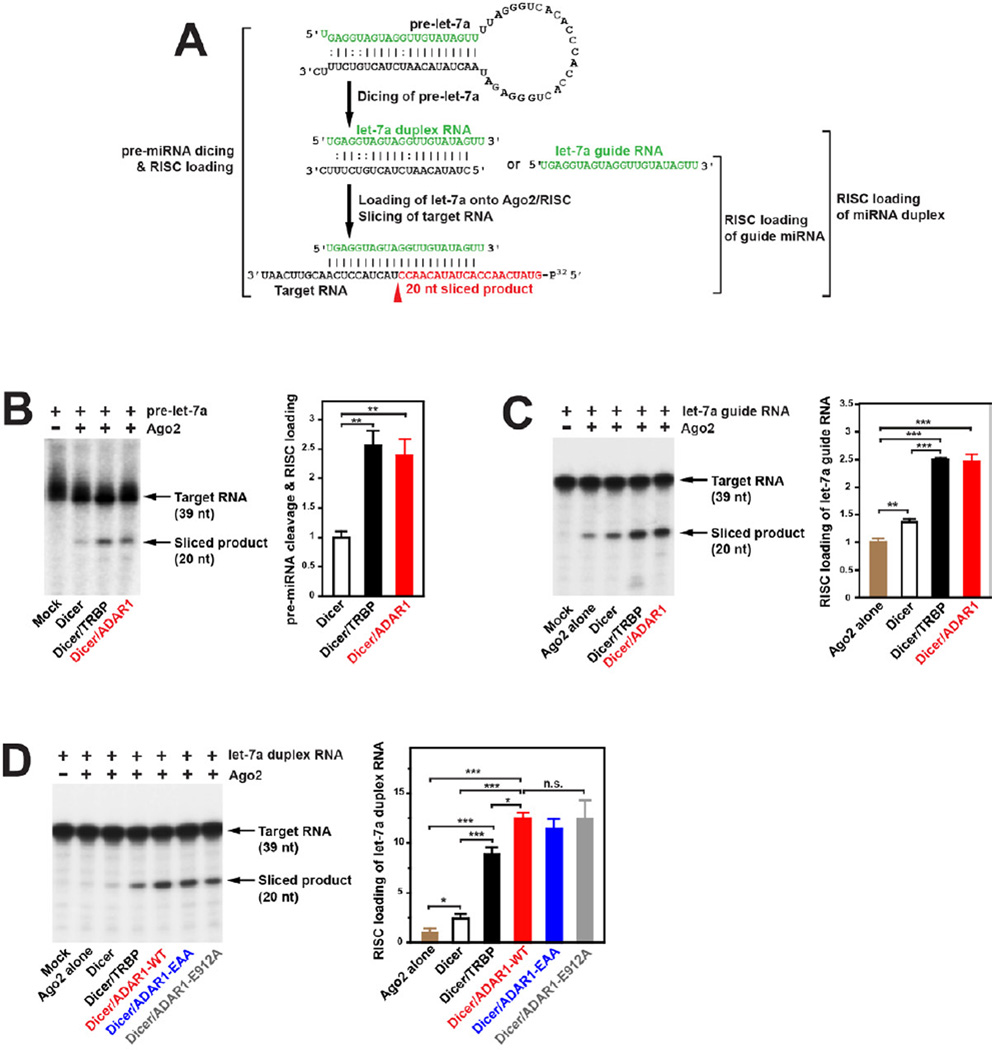
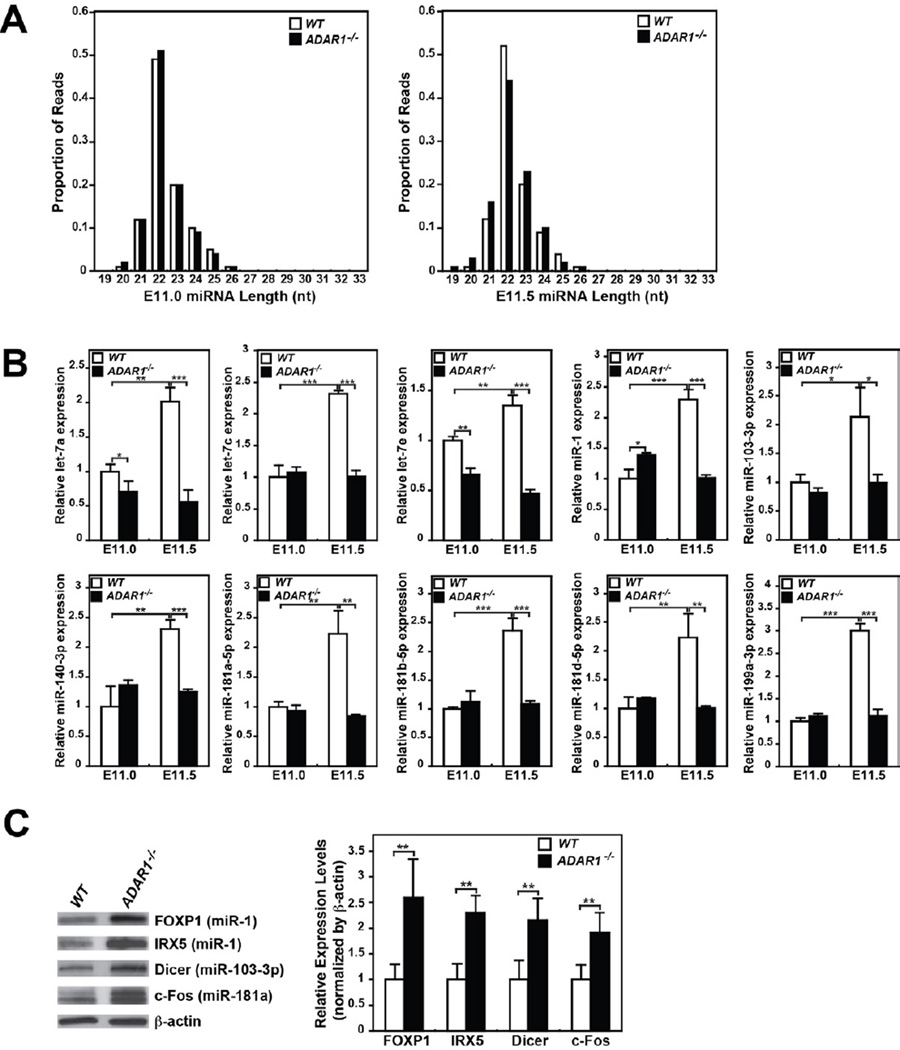
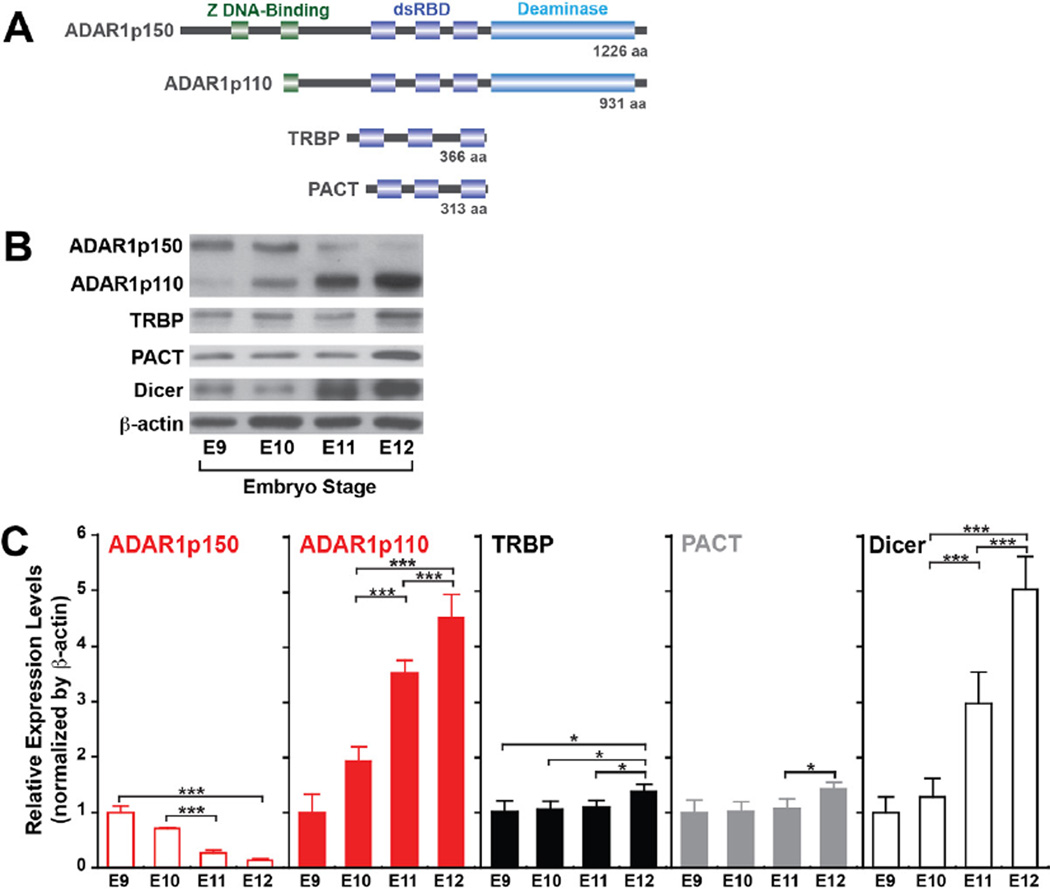
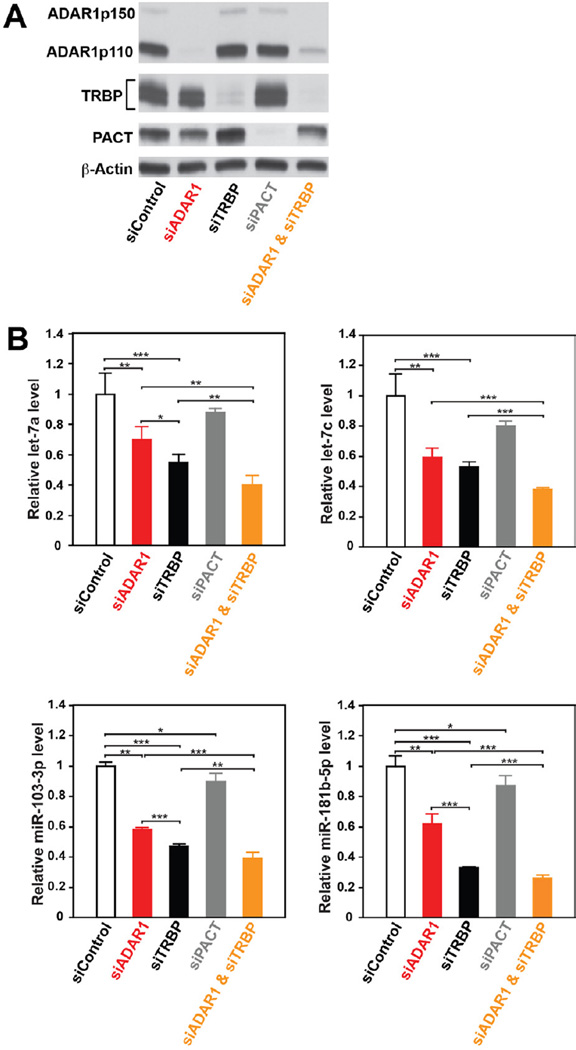
Adenosine deaminases acting on RNA (ADARs) are involved in RNA editing that converts adenosine residues to inosine specifically in double-stranded RNAs. In this study, we investigated the interaction of the RNA editing mechanism with the RNA interference (RNAi) machinery and found that ADAR1 forms a complex with Dicer through direct protein-protein interaction. Most importantly, ADAR1 increases the maximum rate (Vmax) of pre-microRNA (miRNA) cleavage by Dicer and facilitates loading of miRNA onto RNA-induced silencing complexes, identifying a new role of ADAR1 in miRNA processing and RNAi mechanisms. ADAR1 differentiates its functions in RNA editing and RNAi by the formation of either ADAR1/ADAR1 homodimer or Dicer/ADAR1 heterodimer complexes, respectively. As expected, the expression of miRNAs is globally inhibited in ADAR1(-/-) mouse embryos, which, in turn, alters the expression of their target genes and might contribute to their embryonic lethal phenotype.


Figures

Figure 1
Figure 1. ADAR1 interacts with Dicer in an RNA binding-independent manner
(A) Pulldown products of FLAG-tagged RISC member proteins and reciprocal pulldown of FLAG-tagged ADAR1 (F-ADAR1p110) purified from HEK293 cell extracts. Cytoplasmic extract (20 μg) and FLAG-IP peak eluate (15 μl) were examined by immunoblotting analysis. A mock FLAG-IP conducted with untransfected HEK293 cells was used to monitor the background levels of protein that may associate with the FLAG Ab resin (right panels). (B) F-Dicer IP products fractionated by Superose 6 gel filtration column chromatography were analyzed by immunoblotting. The positions of the molecular mass size markers are indicated by open arrowheads. (C) Analysis of recombinant protein interactions in the Sf9 cell co-infection/co-purification system. Various H-ADAR1 expression baculoviruses were co-infected with F-Dicer, untagged TRBP, or F-Ago2 expression viruses. FLAG IP isolated F-Dicer or F-Ago2, and immunoblotting determined their interaction with ADAR1. TALON purifications isolated each H-ADAR1s, and immunoblotting determined their interaction with TRBP. (D) Analysis of recombinant proteins purified from Sf9 cells triple-infected with F-Dicer, H-ADAR1, and HA-Ago2. Immunoblotting determined ADAR1 indirect interaction with Ago2 mediated by Dicer. (E) Analysis of recombinant proteins purified from Sf9 cells triple-infected with F-Dicer, H-ADAR1, and untagged TRBP. FLAG purifications isolated F-Dicer, and immunoblotting determined its relative interaction with ADAR1 and TRBP. (F) Analysis of recombinant proteins purified from Sf9 cells co-infected with F-Dicer and TRBP. FLAG purifications isolated F-Dicer, and immunoblotting determined its relative interaction with TRBP in the absence of ADAR1.
Figure 2
Figure 2. Domains involved in the Dicer/ADAR1 interaction
(A) The domain structures of human ADAR1, Dicer, and their deletion mutants are shown. The extent of Dicer/ADAR1 or ADAR1 homodimer interaction is indicated; positive (+), weakly positive (±), or negative (−). (B) Mapping of the ADAR1 domain involved in the Dicer interaction. The full-length F-Dicer (bait) and full-length or one of the H-ADAR1p110 deletion mutants (prey) were co-infected in Sf9 cells. (C) Mapping of the Dicer domain involved in the ADAR1 interaction. The full-length or one of the F-Dicer deletion mutants (bait) and the full-length H-ADAR1 (prey) were co-infected in Sf9 cells. (D) Mapping of the ADAR1 domain involved in the ADAR1 homodimer interaction. The full-length F-ADAR1p110 (bait) and full-length or one of the H-ADAR1p110 deletion mutants (prey) were co-infected in Sf9 cells. (B, C) FLAG-IP purification was done for isolation of F-Dicer/H-ADAR1 interacting complexes. (D) FLAG-IP purification isolated F-ADAR1/H-ADAR1 interacting complexes. (B, C, D) FLAG-IP products were analyzed by immunoblotting. Left panel, input cell extracts. Right panel, FLAG-IP purified proteins.
Figure 3
Figure 3. ADAR1 augments the Dicer cleavage reaction rate and increases miRNA/siRNA production
(A, C) In vitro miRNA processing analysis. (B, D) In vitro siRNA processing analysis. (A, B, C, D) The Dicer cleavage reaction was done under single-turnover conditions. (E) Michaelis-Menten analysis of the pre-let-7a cleavage reaction. (F) Michaelis-Menten analysis of pre-siRNA cleavage reaction. (E, F) The Dicer cleavage reaction was conducted under multiple-turnover conditions. V0 values were plotted against substrate concentrations, leading to estimation of Vmax values.
Figure 4
Figure 4. ADAR1 augments RISC loading and target RNA silencing efficacy
(A) RISC loading and assays using pre-let-7a, let-7a guide, or let-7a duplex RNA are schematically shown. The let-7a-5p target RNA (39 nt) was 5’ 32P-labeled. Ago2 slicing of the target RNA guided by let-7a-5p would produce a 20-nt product (highlighted in red). (B) Pre-let-7a dicing-coupled RISC loading assay: 10 nM Ago2 used. (C) RISC loading of let-7a guide RNA: 5 nM Ago2 used. (D) RISC loading of let-7a duplex RNA: 5 nM Ago2 used. (B, C, D) Sliced target RNA products were fractionated by 15% Urea-PAGE (left panel). A quantitative summary is also shown (right panel). The target RNA slicing efficiency was estimated by the ratio of the radioactivity of the correctly cleaved band over that of the uncut control band. Significant differences were identified by Student’s t-tests: *, p<0.05; **, p<0.01; ***, p<0.001. Error bars, S.E. (n = 3).
Figure 5
Figure 5. Reduced expression of miRNAs and upregulation of their target genes inADAR1−/− mouse embryos at E11.5
(A) Distribution of miRNA deep sequencing read lengths was compared between wildtype and ADAR1−/− mouse embryos at E11.0 and E11.5 stages. (B) Quantitation of select miRNAs expressed in E11.0 and E11.5 embryos. A spike control, 2 × 10¹⁰ copies of a chemically synthesized RNA, was added to the RT reaction mixture. Quantitative PCR was conducted in quadruplicate. The relative miRNA expression level standardized by the spiked RNA is presented as the expression level relative to that of the wildtype embryo at E11.0. Significant differences were identified by Student’s t-tests: *, p<0.05; **, p<0.01; ***, p<0.001 Error bars, S.D. (n = 5). (C) Increased protein expression of the genes targeted by the miRNAs reduced in ADAR1−/− embryos. Immunoblotting analysis of select target gene levels in E11.5 embryos (left) and a quantitative summary (right). Significant differences were identified by Student’s t-tests: **, p<0.01. Error bars, S.D. (n = 5).
Figure 6
Figure 6. Dicer and ADAR1 are rapidly induced in E11–12 stage embryos
(A) The domain structures of two ADAR1 isoforms, TRBP, and PACT. (B) Immunoblotting analysis of proteins involved in the pre-miRNA processing mechanism. Wildtype mouse embryos collected live at various embryonic stages (E9.0–12.0), and the extracted protein was fractionated by 4–15% SDS-PAGE and tested for immunoblotting analysis. (C) Quantitative summary of immunoblotting analysis results. The relative expression level was normalized by β-actin and presented as the expression level relative to that of the E9.0 embryo. Significant differences were identified by Student’s t-tests: *, p<0.05; ***, p<0.001. Error bars, S.D. (n = 4).
Figure 7
Figure 7. Effects of ADAR1 on RNAi efficacy in HeLa cells
(A) Immunoblotting analysis of ADAR1, TRBP, and PACT protein levels in HeLa cells 72 hrs after transfection with ADAR1, TRBP, PACT, and ADAR1/TRBP siRNAs. (B) Quantification of selected miRNA expression levels by qRT-PCR. The relative expression level was normalized by β-actin and presented as the expression level relative to that of HeLa cells treated with control siRNA. Significant differences were identified by Student’s t-tests: *, p<0.05; **, p<0.01***, p<0.001 Error bars, S.D. (n = 4).

Similar articles

Cited by

References

    1. Chakravarthy S, Sternberg SH, Kellenberger CA, Doudna JA. Substrate-specific kinetics of Dicer-catalyzed RNA processing. J. Mol. Biol. 2010;404:392–402. - PMC - PubMed
    1. Chendrimada TP, Gregory RI, Kumaraswamy E, Norman J, Cooch N, Nishikura K, Shiekhattar R. TRBP recruits the Dicer complex to Ago2 for microRNA processing and gene silencing. Nature. 2005;436:740–744. - PMC - PubMed
    1. Cho DS, Yang W, Lee JT, Shiekhattar R, Murray JM, Nishikura K. Requirement of dimerization for RNA editing activity of adenosine deaminases acting on RNA. J. Biol. Chem. 2003;278:17093–17102. - PubMed
    1. Daniels SM, Melendez-Pena CE, Scarborough RJ, Daher A, Christensen HS, El Far M, Purcell DF, Laine S, Gatignol A. Characterization of the TRBP domain required for dicer interaction and function in RNA interference. BMC Mol. Biol. 2009;10:38. - PMC - PubMed
    1. Dlakic M. DUF283 domain of Dicer proteins has a double-stranded RNA-binding fold. Bioinformatics. 2006;22:2711–2714. - PubMed

Publication types

MeSH terms

Associated data