. 2013 Apr 25;153(3):654-65.
doi: 10.1016/j.cell.2013.03.043.

Mapping the human miRNA interactome by CLASH reveals frequent noncanonical binding

Affiliations

Mapping the human miRNA interactome by CLASH reveals frequent noncanonical binding

Aleksandra Helwak et al. Cell. .

Abstract

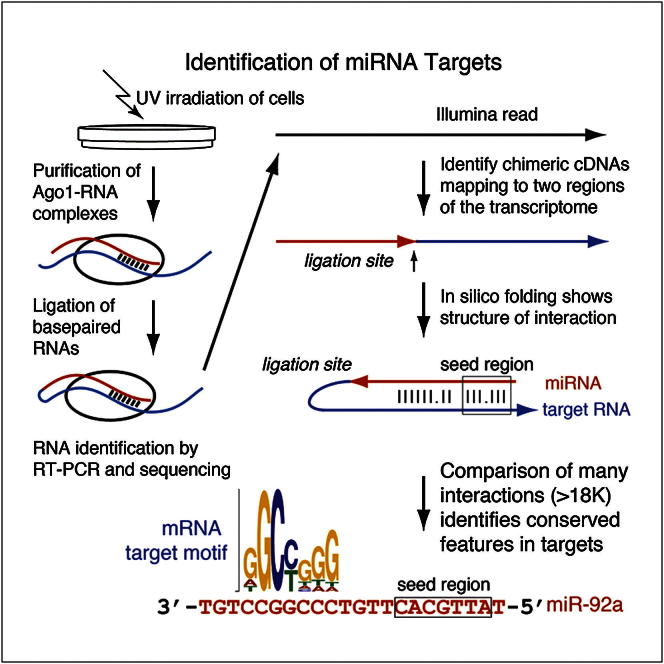
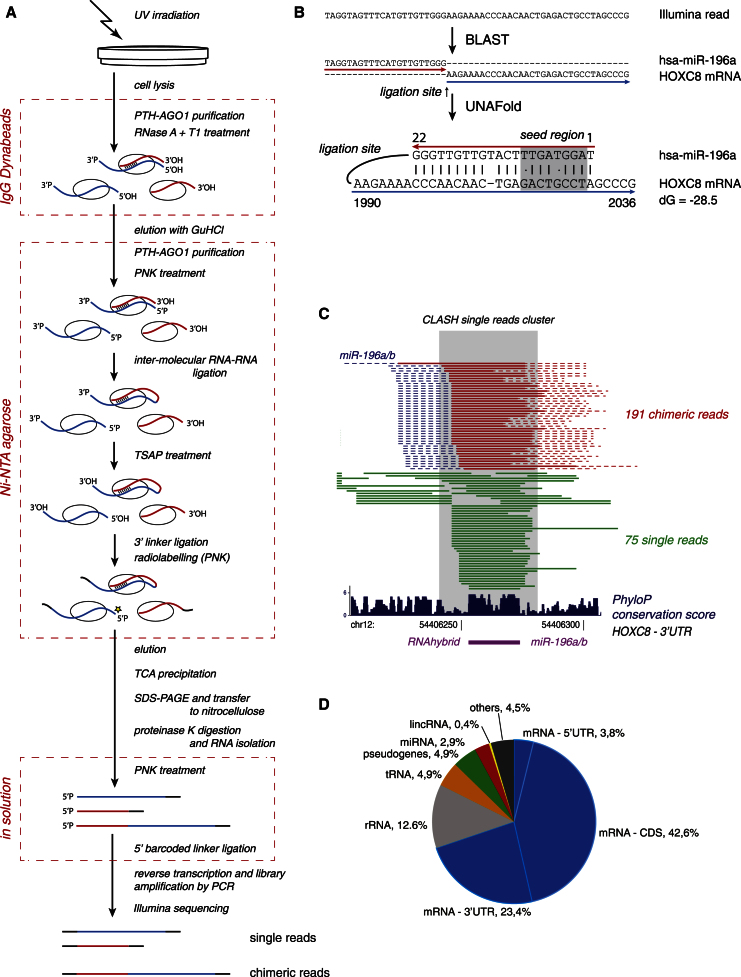
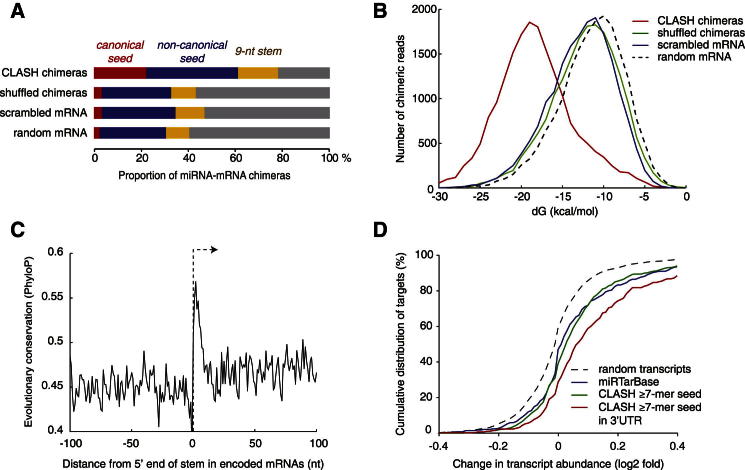
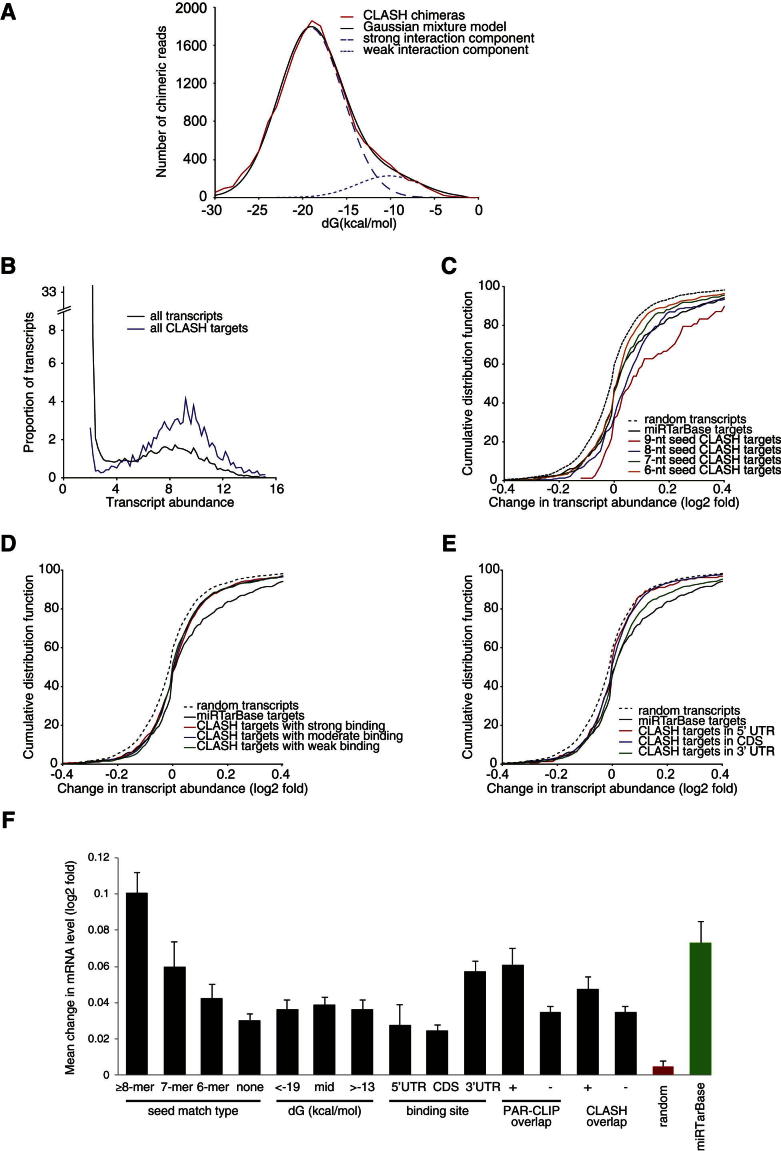
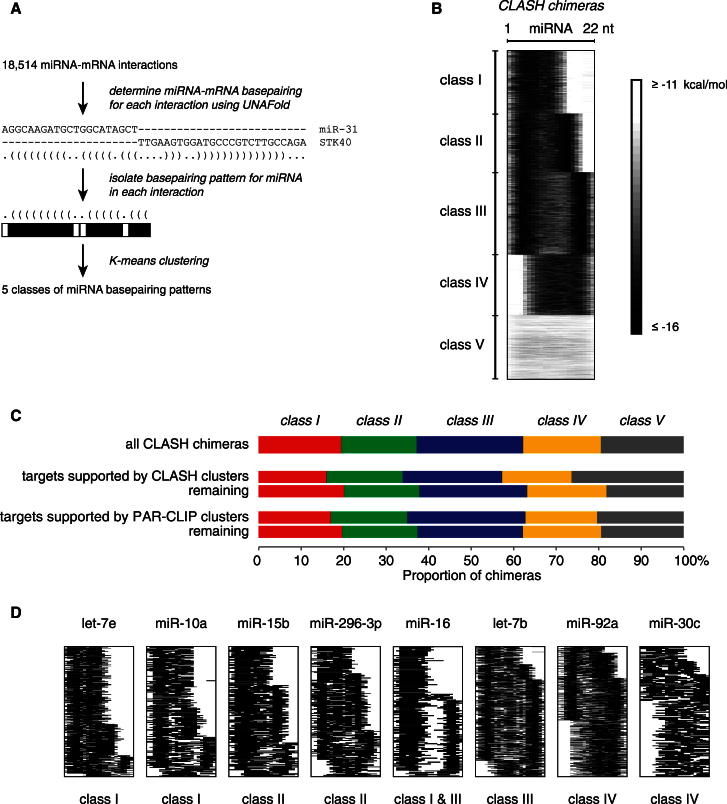
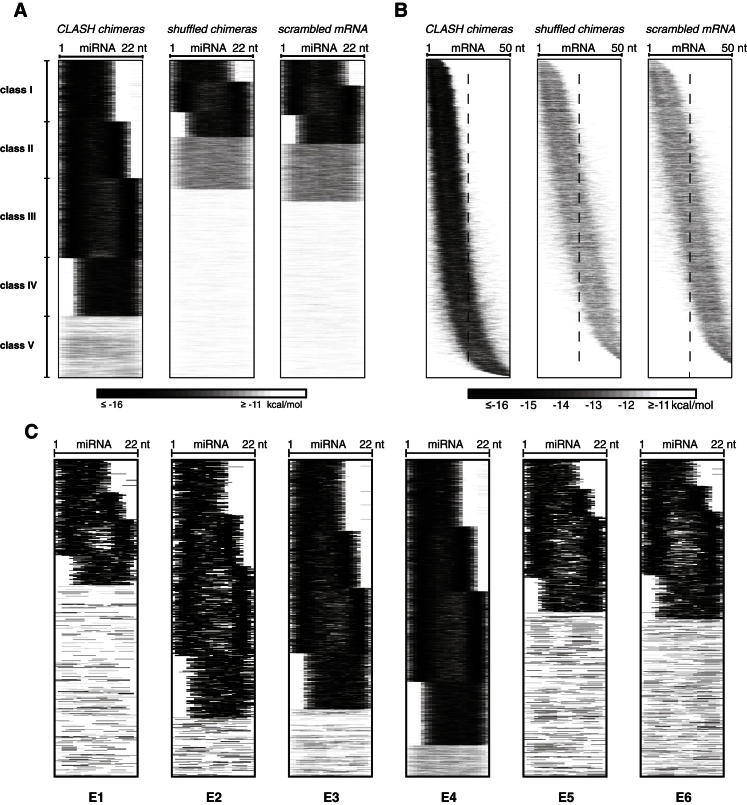
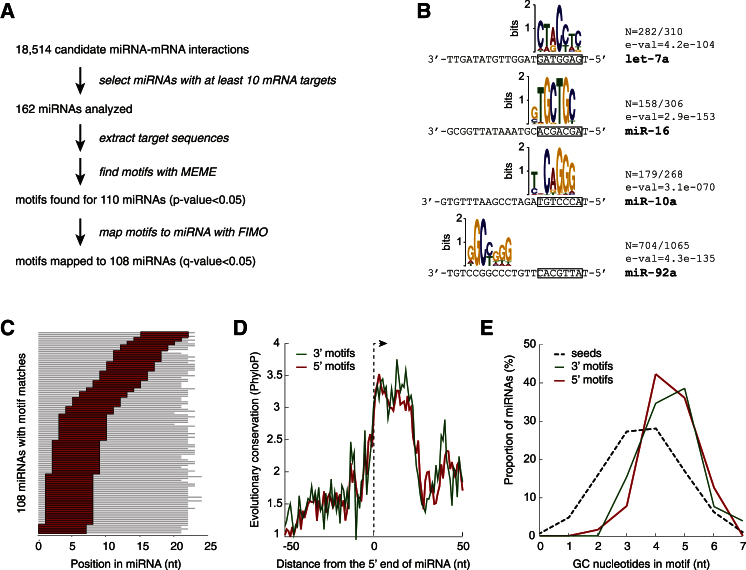
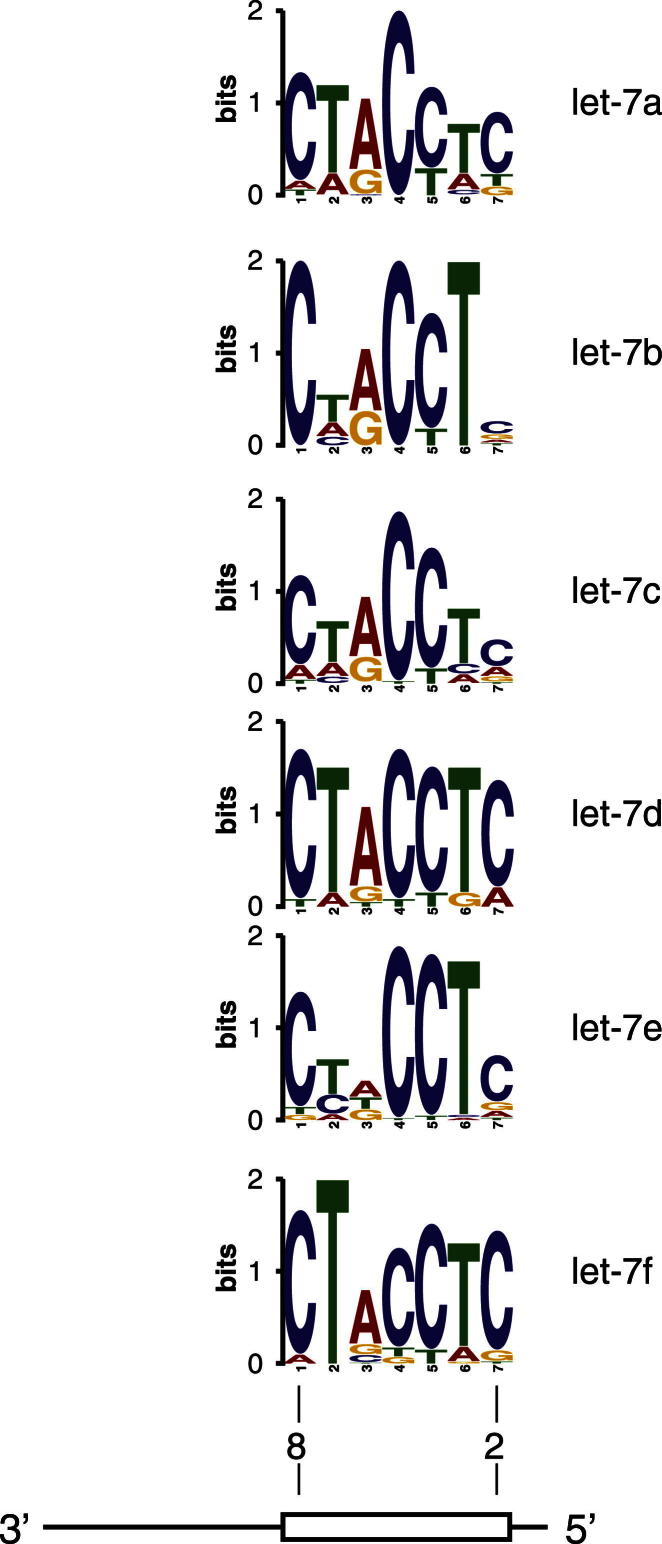
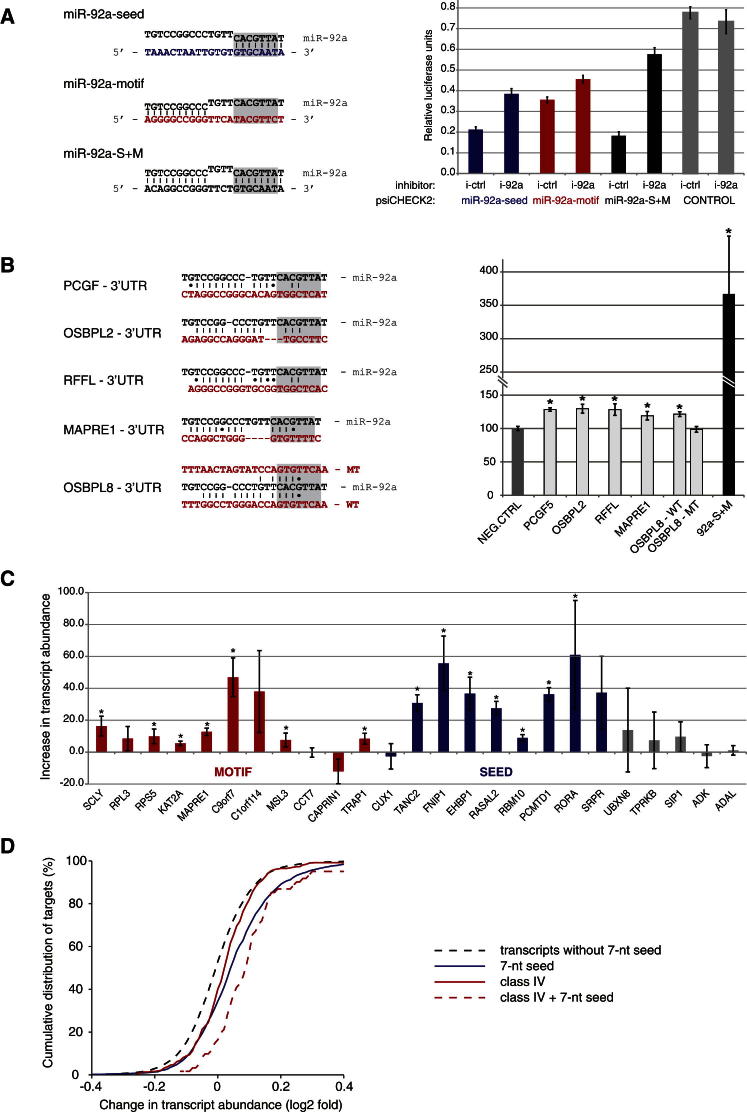
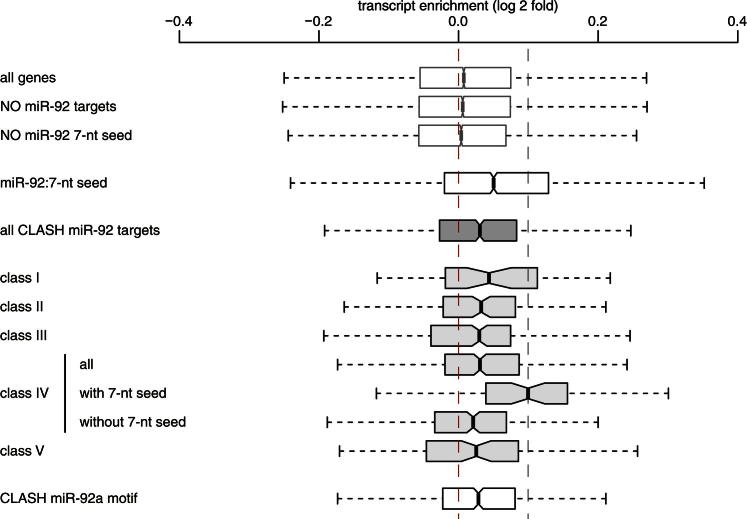
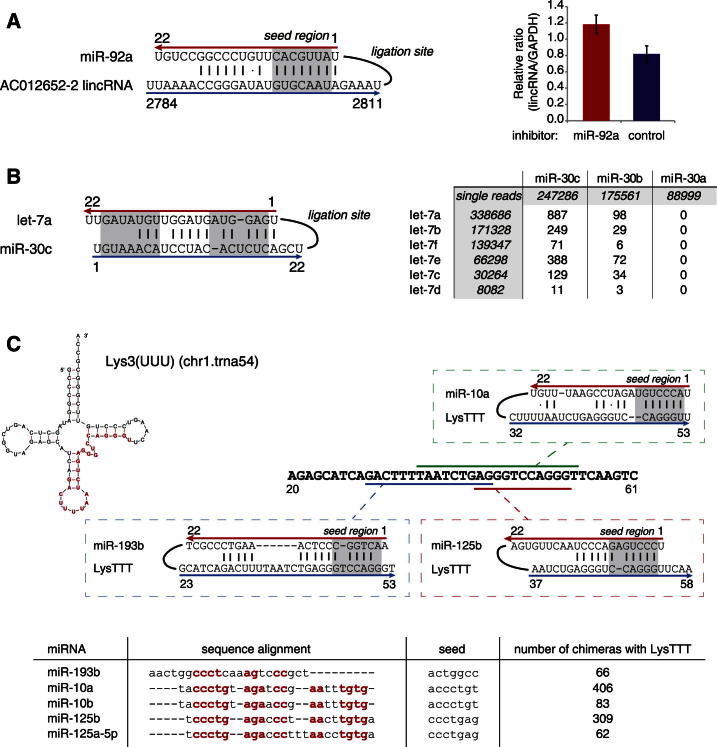
MicroRNAs (miRNAs) play key roles in gene regulation, but reliable bioinformatic or experimental identification of their targets remains difficult. To provide an unbiased view of human miRNA targets, we developed a technique for ligation and sequencing of miRNA-target RNA duplexes associated with human AGO1. Here, we report data sets of more than 18,000 high-confidence miRNA-mRNA interactions. The binding of most miRNAs includes the 5' seed region, but around 60% of seed interactions are noncanonical, containing bulged or mismatched nucleotides. Moreover, seed interactions are generally accompanied by specific, nonseed base pairing. 18% of miRNA-mRNA interactions involve the miRNA 3' end, with little evidence for 5' contacts, and some of these were functionally validated. Analyses of miRNA:mRNA base pairing showed that miRNA species systematically differ in their target RNA interactions, and strongly overrepresented motifs were found in the interaction sites of several miRNAs. We speculate that these affect the response of RISC to miRNA-target binding.


Figures

None
Graphical abstract
Figure 1
Figure 1
Overview of Experimental and Bioinformatic Procedures (A) Growing cells were UV irradiated, and PTH-AGO1 was purified. RNA fragmentation, ligation, cDNA synthesis, and sequencing of AGO1-associated RNAs allowed the identification of sites of AGO1 binding (as single reads) and RNA-RNA interactions at AGO1-binding sites (as chimeric reads). (B) Sequencing reads were mapped to a database of human transcripts using BLAST (Altschul et al., 1990). Sequences reliably mapped to two different sites were folded in silico using UNAFold (Markham and Zuker, 2008) to identify the interaction site of the RNA molecules that gave rise to the chimeric cDNA. (C) Example interaction between miR-196a/b and HOXC8 that was supported by chimeric reads (red), and a cluster of nonchimeric reads (green). The blue dashed line represents the location of the miRNA bit of chimera, and the red dashed line shows the 25 nt mRNA extension added during the analysis. The interaction was previously shown experimentally (Li et al., 2010) and can be predicted by RNAhybrid (Rehmsmeier et al., 2004). (D) Distribution of all miRNA interactions among various classes of RNAs. The main miRNA targets are mRNAs and are represented by 18,514 interactions. See also Figure S1 and Tables S1 and S2A–S2C.
Figure S1
Figure S1
Comparison of CLASH Data Sets E1–E6, Related to Figure 1 The graphs present the number of reads mapped to each mRNA in experiment E4 relative to the other experiments. R – Pearson’s correlation coefficient.
Figure 2
Figure 2
Bioinformatic and Experimental Validation of miRNA-mRNA Interactions (A) Proportion of canonical seed interactions (exact Watson-Crick pairing of nts 2–7 or 3–8 of the miRNA), noncanonical seed interactions (pairing in positions 2–7 or 3–8, allowing G-U pairs and up to one bulged or mismatched nucleotide), or 9 nt stems (allowing bulged nucleotides in the target) among CLASH chimeras and several randomized data sets; the differences between CLASH and randomized data sets were highly significant (chi-square tests, p < 10−300, p < 10−100, and p < 10−80 for canonical seeds, noncanonical seeds, and stems, respectively). (B) The mean predicted binding energy between miRNA and matching target mRNA found in chimeras was stronger by over 5 kcal mol−1 than in randomly matched pairs (t test, p < 10−300). (C) Average conservation score along mRNA 3′ UTRs, centered at the 5′ end of the longest stem predicted within each CLASH target. The mean conservation score within predicted stems was significantly higher than in flanking regions of the 3′ UTR (0.54 versus 0.46, t test, p < 10−26, n = 4634). (D) Changes in mRNA abundance following the depletion of 25 miRNAs (Hafner et al., 2010a). The graph shows a cumulative distribution of the log2 fold change (LFC) of mRNA abundance upon miRNA depletion for different sets of mRNAs: targets of the 25 miRNAs identified by CLASH with a 7-mer seed match (green line), CLASH targets in the 3′ UTR with 7-mer seed match (red line), targets extracted from the miRTarBase (blue line), and random transcripts with expression levels matching the CLASH targets (dashed line). Displacement of the curve to the right reveals increased abundance following miRNA depletion, which is indicative of mRNA repression in the presence of the tested miRNAs. See also Figure S2; Tables S3, S4A, and S4B; and Data S1.
Figure S2
Figure S2
Validation of miRNA Targets, Related to Figure 2 (A) Distribution of predicted miRNA-mRNA interaction stability. A Gaussian mixture model (black line) fitted to the observed distribution of folding energies in the chimeric sequences recovered (red line) using the least-squares method. The weak-interaction component (11% of interactions, dotted blue line) is similar to random interactions (see Figure 2B). Comparison to the distribution of different classes of miRNA-mRNA interactions recovered in individual CLASH experiments (see Figure S3, below) indicates that the weak-interaction component is the least reproducible and is therefore likely to have a higher contribution of noise (for example, random ligation between RNA fragments in solution, or reverse transcriptase template switching events). The remaining 89% of the observed chimeras show stronger folding (dashed blue line), most probably because they predominately originate from genuine miRNA-mRNA hybrids. (B–F) Transcriptome-wide changes in the levels of mRNAs identified as miRNA targets by CLASH were assessed by retrospective analysis of the reported effects of simultaneous depletion of 25 different miRNAs (Hafner et al., 2010a). The mRNAs were filtered by the location and nature of the miRNA-mRNA interactions identified by CLASH. (B) CLASH identifies miRNA targets among transcripts of various abundance levels. (C) Changes in mRNA abundance following the depletion of 25 miRNAs are shown for: Known targets of these miRNAs downloaded from miRTarBase, for CLASH targets with different lengths of k-mer seed matches with any of the 25 miRNAs and for a set of random transcripts with expression levels similar to the CLASH targets. (D) CLASH targets were categorized according to their predicted binding energy with miRNA; strong binding, dG < −19.4 kcal/mol; weak binding, dG > −13.4 kcal/mol. (E) CLASH targets were categorized according to the position of their binding site in the transcript. (F) Mean changes in transcript abundance for CLASH targets categorized by seed match length, location, predicted binding energy, and presence or absence of overlap with AGO binding clusters from PAR-CLIP (Hafner et al., 2010a) or CLASH (present study). Error bars represent standard error. All classes of targets, except the 5′ UTR class, are significantly different from random (p < 0.05, Wilcoxon rank sum test with Bonferroni correction).
Figure 3
Figure 3
Base-Pairing Patterns in miRNA-mRNA Interactions (A) Outline of the analysis of miRNA-mRNA base-pairing patterns. Unpaired nucleotides are in white, and paired nucleotides are in shades of gray depending on the overall interaction strength. (B) Positions of base-paired nucleotides in miRNAs among the 18,514 miRNA-mRNA interactions. The names of interaction classes (I–V) are indicated. (C) Distribution of CLASH targets among the five base-pairing classes. A similar proportion of CLASH targets from each class are supported by experimentally determined AGO-binding sites, as identified by CLASH single read clusters and PAR-CLIP clusters. (D) Examples of miRNAs with nonrandom distribution across interaction classes. Of the 68 miRNAs tested, 31 were nonrandomly distributed across four classes of interaction (p < 0.05, chi-square test with Bonferroni correction; class V interactions were excluded from this analysis). See also Figure S3 and Data S2.
Figure S3
Figure S3
Patterns of miRNA Interactions with mRNAs, Related to Figure 3 (A) Location of base-paired nucleotides in miRNAs. For each miRNA-mRNA interaction, the minimum energy structure was determined using the hybrid-min program (Markham and Zuker, 2008). Unpaired nucleotides are shown in white and paired nucleotides are in shades of gray depending on the overall interaction strength. Similar interactions were grouped together by K-means clustering (K = 5). Left, interactions identified by CLASH; center, interactions between randomly reassigned (shuffled) miRNA-mRNA pairs; right, interactions between miRNAs and scrambled (randomly permuted) mRNA sequences. (B) Location of base-paired nucleotides in mRNAs. The mRNA fragments are ordered by the mean coordinate of the base-paired nucleotides in each fragment. Basepairing is usually confined to the first 25 nucleotides in CLASH targets. (C) Patterns of miRNA interactions in replicate experiments.
Figure 4
Figure 4
Sequence Motifs Associated with miRNA-Binding Sites (A) Discovery pipeline for overrepresented motifs in miRNA targets. Target sequences with 25 nt flanking genomic sequence were analyzed by MEME (Bailey and Elkan, 1994), and 7-mer motifs were considered. 108 could be mapped back to the miRNA by FIMO (Grant et al., 2011) with FDR < 0.05. (B) Example motifs bound by miRNA. n, number of motifs found/total number of targets analyzed. E-val, e-value of the motif returned by MEME. Most motifs are complementary to the miRNA seed (boxed). (C) Distribution of conserved motif positions within 108 miRNAs. In most cases, the motifs enriched in miRNA targets were complementary to the miRNA seed (nt 1–9); however, some highly enriched motifs were complementary to regions in the middle or 3′ ends of the miRNA. (D) Conservation patterns among 108 miRNAs with recognizable target motif sequences. miRNAs were partitioned by most enriched motif location into groups predicted to form seed and nonseed interactions. The 5′ half of the miRNA is more conserved among the seed-interacting group (average difference in PhyloP scores [Pollard et al., 2010] between 5′ and 3′ halves, ΔPhyloP = 0.122, t test, p = 0.001). The 3′ half of the miRNA is more conserved among the nonseed interacting group (ΔPhyloP = –0.164, p = 0.002). (E) Distribution of GC content in motifs (n = 108) and miRNA seeds (n = 1100). The average guanine plus cytosine (GC) content of the binding motifs was higher than the average GC content of miRNA seeds in human. See also Figure S4 and Table S5.
Figure S4
Figure S4
Comparison of Motifs Identified in Targets of let-7 Family miRNAs, Related to Figure 4
Figure 5
Figure 5
Experimental Validation of Noncanonical Interactions (A) Reporter vectors were constructed by inserting miR-92a-binding sites matching the seed, 3′ motif, or seed+3′ motif (S+M) (left) into the 3′ UTR of Renilla luciferase in a psiCHECK2 vector. Renilla to firefly luciferase ratios are shown with error bars representing SE from four independent experiments (right). All binding sites caused miR-92-dependent downregulation of luciferase expression (p < 0.05, t test). (B) Reporter vectors were constructed by inserting 3′ UTRs of identified class IV miR-92a targets into the 3′ UTR of Renilla luciferase in a psiCHECK2 vector. Mean changes in Renilla to firefly luciferase ratios upon treatment with miR-92a inhibitors are shown with error bars representing SE from at least three independent experiments (right). A schematic of the CLASH identified miR-92a-binding sites within those UTRs, and sites of mutagenesis within one of the reporters are depicted on the left. All wild-type-binding sites resulted in significant increase of Renilla luciferase signal (p < 0.05, t test, marked with an asterisk), and mutagenesis of identified binding site resulted in reverting this effect. (C) Experimental validation of selected CLASH targets with miR-92a seed-only binding sites (blue), miR-92a motif-only binding sites (red), or negative controls (gray). Increase in transcript abundance upon inhibition of endogenous miR-92a was quantified by qRT-PCR and internally normalized to GAPDH. The bars represent the average from three independent experiments, error bars represent SD, and samples with p < 0.05 (t test) are marked with an asterisk. (D) Changes in mRNA abundance upon miR-92a depletion in cells measured by microarrays. The graph shows a cumulative distribution of the log2 fold change (LFC) of mRNA abundance for various kinds of miR-92a targets. Transcripts without 7-mer seed serve as negative control. See also Figure S5.
Figure S5
Figure S5
Experimental Validation of CLASH Identified miR-92a Targets, Related to Figure 5 Changes in mRNA abundance upon miR-92a depletion in PTH-AGO1-HEK293 cells, measured by Affymetrix microarrays. The performance of various classes of miR-92a targets identified in CLASH analyses, and targets containing the miR-92a motif, are compared to transcripts containing a match to the miR-92a 7-mer seed sequence (positive control), to random transcripts, and to targets lacking a match to the miR-92a 7-mer seed (negative control). The left and right edge of the box represent 25th and 75th percentile, respectively. The ends of the whiskers show the minimum and maximum values of the data.
Figure 6
Figure 6
Examples of Interactions between miRNAs and Non-mRNA Targets (A) Experimentally validated, reproducible interaction between miR-92a and lincRNA AC012652-2 with canonical seed match. Change in the expression level of the lincRNA upon miR-92a inhibition was estimated by qRT-PCR. The error bar represents SE from three biological replicate experiments. (B) Putative interaction between miR-30 and let-7; left, folded structure of miR-30c- let-7a chimera; right, numbers of chimeras supporting the interactions between pairs of let-7 and miR-30 family members. The specificity of the interaction is supported by the presence of multiple chimeras between let-7 and miR-30b/c, and the absence of chimeras between let-7 and miR-30a. (C) Putative interactions between miRNAs and tRNALys3(UUU). miR-10a, miR-10b, miR-125b, miR-125a-5p, and miR-193b bind with high reproducibility to the same region of tRNALys3(UUU), marked red on the tRNA structure (chr1.trna54). As shown in the sequence alignment, these miRNAs have different seed sequences but are similar overall. See also Data S3.

References

    1. Altschul S.F., Gish W., Miller W., Myers E.W., Lipman D.J. Basic local alignment search tool. J. Mol. Biol. 1990;215:403–410. - PubMed
    1. Bailey, T.L., and Elkan, C. (1994). Fitting a mixture model by expectation maximization to discover motifs in biopolymers. Proceedings of the Second International Conference on Intelligent Systems for Molecular Biology, 28–36. - PubMed
    1. Barat C., Lullien V., Schatz O., Keith G., Nugeyre M.T., Grüninger-Leitch F., Barré-Sinoussi F., LeGrice S.F., Darlix J.L. HIV-1 reverse transcriptase specifically interacts with the anticodon domain of its cognate primer tRNA. EMBO J. 1989;8:3279–3285. - PMC - PubMed
    1. Bartel D.P. MicroRNAs: target recognition and regulatory functions. Cell. 2009;136:215–233. - PMC - PubMed
    1. Broderick J.A., Salomon W.E., Ryder S.P., Aronin N., Zamore P.D. Argonaute protein identity and pairing geometry determine cooperativity in mammalian RNA silencing. RNA. 2011;17:1858–1869. - PMC - PubMed

Supplemental References

    1. Dennis G., Jr., Sherman B.T., Hosack D.A., Yang J., Gao W., Lane H.C., Lempicki R.A. DAVID: Database for Annotation, Visualization, and Integrated Discovery. Genome Biol. 2003;4:3. - PubMed
    1. Fujita P.A., Rhead B., Zweig A.S., Hinrichs A.S., Karolchik D., Cline M.S., Goldman M., Barber G.P., Clawson H., Coelho A. The UCSC Genome Browser database: update 2011. Nucleic Acids Res. 2011;39(Database issue):D876–D882. - PMC - PubMed
    1. Griffiths-Jones S., Saini H.K., van Dongen S., Enright A.J. miRBase: tools for microRNA genomics. Nucleic Acids Res. 2008;36(Database issue):D154–D158. - PMC - PubMed
    1. Kent W.J., Sugnet C.W., Furey T.S., Roskin K.M., Pringle T.H., Zahler A.M., Haussler D. The human genome browser at UCSC. Genome Res. 2002;12:996–1006. - PMC - PubMed
    1. Oeffinger M., Wei K.E., Rogers R., DeGrasse J.A., Chait B.T., Aitchison J.D., Rout M.P. Comprehensive analysis of diverse ribonucleoprotein complexes. Nat. Methods. 2007;4:951–956. - PubMed

Publication types

Associated data