. 2013 Apr 25;153(3):707-20.
doi: 10.1016/j.cell.2013.03.030.

Integrated systems approach identifies genetic nodes and networks in late-onset Alzheimer's disease

Affiliations

Integrated systems approach identifies genetic nodes and networks in late-onset Alzheimer's disease

Bin Zhang et al. Cell. .

Abstract

The genetics of complex disease produce alterations in the molecular interactions of cellular pathways whose collective effect may become clear through the organized structure of molecular networks. To characterize molecular systems associated with late-onset Alzheimer's disease (LOAD), we constructed gene-regulatory networks in 1,647 postmortem brain tissues from LOAD patients and nondemented subjects, and we demonstrate that LOAD reconfigures specific portions of the molecular interaction structure. Through an integrative network-based approach, we rank-ordered these network structures for relevance to LOAD pathology, highlighting an immune- and microglia-specific module that is dominated by genes involved in pathogen phagocytosis, contains TYROBP as a key regulator, and is upregulated in LOAD. Mouse microglia cells overexpressing intact or truncated TYROBP revealed expression changes that significantly overlapped the human brain TYROBP network. Thus the causal network structure is a useful predictor of response to gene perturbations and presents a framework to test models of disease mechanisms underlying LOAD.


Figures

Figure 1
Figure 1. Sample Processing and the Integrative Network-based Approach
(A) 549 brains were collected through the Harvard Brain Tissue Resource Center (HBTRC) from 376 LOAD patients and 173 non-demented subjects and tissues extracted from three brain regions, the commonly affected PFC in LOAD, and the less affected VC and CB 1). Each brain went through extensive neuropathology examination, and all tissues were profiled for 39,579 transcripts and every subject genotyped for 838,958 SNPs 2). These datasets were the basis of the method development in the present study 3). (B) From the microarray RNA expression data we identified gene expression traits showing individual variability in gene expression traits as per brain region 1). Next we computed the co-regulation (connectivity) strength between genes, defined the appropriate connectivity threshold 2), and performed hierarchical clustering analysis to construct the undirected co-expression network 3). Finally, we used brain eSNPs (Q) as causal anchors in the construction of directed Bayesian networks to infer a causal relationship between nodes in the network 4). A variant of the underlying causality scoring process here can be applied to relationships among thousands of nodes to infer genome-scale networks. (C) Comparison of LOAD and non-demented networks was performed to explore any effect on the molecular interaction structure associated with the disease. Differentially connected modules in LOAD were investigated for their functional organization 1), module relevance to clinical outcome as well as the enrichment of brain eSNPs 2). Modules were rank-ordered (this figure does not show the true rank order) for their strength of the functional enrichment, module correlation to neuropathology and eSNP enrichment 3). See also Figure S1.
Figure 2
Figure 2. Differential Gene Expression in LOAD Brains and Expression Correlation to Braak stage
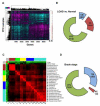
(A) The heat-plot shows the genes (n=6457), absolute mean-log ratio >1.5 for each profile, which most significantly differentiate disease status in PFC. The legend to the right shows the arrangement of samples with blue points denoting LOAD (A), and red points denoting non-demented state (N). (B) The number of differentially expressed genes in LOAD compared with controls per brain region using Bonferroni adjusted P<0.05 by correcting for the number of probes tested (P ≤ 2.46×10⁻⁷). (C) Clustering analysis where the rows and columns represent age and 25 LOAD pathology traits are arranged in a symmetric fashion and sorted by the hierarchical clustering tree of the correlation matrix. The color intensity signifies the correlation strength between two traits (red positive and green negative). AT, atrophy; WMAT, white matter atrophy; EL, enlargement. (D) Number of genes showing significant expression correlation to Braak stage as measured per brain region using Bonferroni adjusted P<0.05 by correcting for the number of probes tested (P ≤ 2.46×10⁻⁷). See also Table S1.
Figure 3
Figure 3. Multi-Tissue Gene Co-expression Network in LOAD Brains
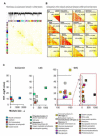
(A) The topological overlap matrix (TOM) plot corresponds to the LOAD multi-tissue co-expression network. The rows and columns represent the same set of the top one-third (13,193) of the most variably expressed genes in each of the three brain tissues and states, expressed in a symmetric fashion and sorted by the hierarchical clustering tree of the LOAD network. (B) Individual TOM covariance matrices of 15 differentially connected and one conserved modules in LOAD (the upper right triangle of each module) versus that in the non-demented state (the lower left triangle of each module). Differential connectivity (MDC) and FDR estimate is specified in each panel in parenthesis (MDC, FDR). (C) Significant (FET P-value after correcting for number of modules and functional categories/pathways tested) enrichment of functional categories in conserved modules (left most panel), LOC modules (center panel) or GOC modules (right most panel). The y-axis represents the −log(P-value) of enrichment while the x-axis denotes the number of genes per module. Each module contains at least 50 unique gene symbols. See also Table S1.
Figure 4
Figure 4. Module Relevance to LOAD Pathology and Enrichment of Brain eSNPs
(A) A heat-map of the correlations (∣r∣) between 49 module principal components (PCs) and 25 LOAD-related neuropathology traits. These modules contain at least 100 probes. AT, atrophy; WMAT, white matter atrophy; EL, enlargement. (B) Number of significant module-dependent correlation to LOAD related neuropathology of all differentially connected modules with at least 100 members and showing significant correlation to at least single neuropathology trait (see Extended Experimental Procedures). The total number of traits associated with a module was used to rank-order modules for relevance to LOAD pathology. (C) We tested the enrichment of brain eSNPs in the differentially connected modules of the multi-tissue co-expression network in LOAD as per brain region. Here we present a significant enrichment of brain eSNPs in many of the PFC modules. We used the FET analysis to access the significance of the overlap between each module and cis eSNPs, correcting for the number of modules tested. See also Figure S2 and Table S1.
Figure 5
Figure 5. The Bayesian Brain Immune and Microglia Module
A module that correlates with multiple LOAD clinical covariates and is enriched for immune functions and pathways related to microglia activity (PFC module shown). [Inner networks] The PFC module is enriched in genes which can be classified as members of the complement cascade, ‘Complement’, toll-like receptor signaling, ‘Toll-like’, chemokines/cytokines, ‘Chemokine’, and the major histocompatibility complex, ‘MHC’, or Fc receptor system, ‘Fc’. The direction and strength of interactions between these pathways are collected across all gene-gene causal relationships that span different pathways. The minimum line width corresponds to a single interaction (MHC to toll-like) and scales linearly to a maximum of 17 interactions (Fc to Complement). [Outer networks] Each color-coded group of genes consists of the core members of the different families and genes that are causally related to a given family. Core family members of each pathway are shaded darkly, while square nodes in any family denote literature-supported nodes (at least two PubMed abstracts implicating the gene or final protein complex in LOAD or a model of LOAD). Labeled nodes are either highly connected in the original network, literature-implicated LOAD genes or core members of one of the five immune families. Node size is proportional to connectivity in the module. See also Figures S5.
Figure 6
Figure 6. Structure of Causal Networks Guides Differential Expression in a Distance-dependent Manner
A) Within the microglia module, we show all genes which receive direct or indirect causal inputs to/from TYROBP. Genes which were differentially expressed in either full-length or truncated Tyrobp experiments are circled (P-value<0.05, n=4/4/4 for control/truncated/full-length RNA sequenced samples). Possible reasons for differentially expressed (DE) of predicted upstream genes are mouse-human network differences, network inaccuracy, or presence of feedback loops, which are not represented in a Bayesian framework. (B) We mapped results of RNA sequencing experiments onto a large Bayesian network of ~8000 nodes that contains the microglia module as well as many other modules. In this large network, we could track differential expression of genes which are predicted to be downstream of TYROBP at various network distances (link distances). There was a strong negative correlation (r= −0.82, P=4.e-07) between the differentially expressed genes in the microglia and the path distance from TYROBP in the brain immune network. See also Figure S6 and Table S1.

Similar articles

Cited by

References

    1. Ansari MA, Scheff SW. Oxidative stress in the progression of Alzheimer disease in the frontal cortex. J Neuropathol Exp Neurol. 2010;69:155–167. - PMC - PubMed
    1. Bayes A, van de Lagemaat LN, Collins MO, Croning MD, Whittle IR, Choudhary JS, Grant SG. Characterization of the proteome, diseases and evolution of the human postsynaptic density. Nat Neurosci. 2011;14:19–21. - PMC - PubMed
    1. Bertram L, Lill CM, Tanzi RE. The genetics of Alzheimer disease: back to the future. Neuron. 2010;68:270–281. - PubMed
    1. Bettens K, Sleegers K, Van Broeckhoven C. Genetic insights in Alzheimer’s disease. Lancet Neurol. 2013;12:92–104. - PubMed
    1. Bianchin MM, Martin KC, de Souza AC, de Oliveira MA, Rieder CR. Nasu-Hakola disease and primary microglial dysfunction. Nat Rev Neurol. 2010;6:193–201. - PubMed

Publication types

Substances

Associated data