CSF biomarker variability in the Alzheimer's Association quality control program
- PMID: 23622690
- PMCID: PMC3707386
- DOI: 10.1016/j.jalz.2013.01.010
CSF biomarker variability in the Alzheimer's Association quality control program
Erratum in
- Alzheimers Dement. 2015 Feb;11(2):237. Käser, Stephan A [corrected to Kaeser, Stephan A]; Rissman, Robert [corrected to Rissman, Robert A]
Abstract
Background: The cerebrospinal fluid (CSF) biomarkers amyloid beta 1-42, total tau, and phosphorylated tau are used increasingly for Alzheimer's disease (AD) research and patient management. However, there are large variations in biomarker measurements among and within laboratories.
Methods: Data from the first nine rounds of the Alzheimer's Association quality control program was used to define the extent and sources of analytical variability. In each round, three CSF samples prepared at the Clinical Neurochemistry Laboratory (Mölndal, Sweden) were analyzed by single-analyte enzyme-linked immunosorbent assay (ELISA), a multiplexing xMAP assay, or an immunoassay with electrochemoluminescence detection.
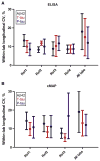
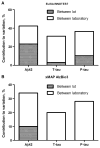
Results: A total of 84 laboratories participated. Coefficients of variation (CVs) between laboratories were around 20% to 30%; within-run CVs, less than 5% to 10%; and longitudinal within-laboratory CVs, 5% to 19%. Interestingly, longitudinal within-laboratory CV differed between biomarkers at individual laboratories, suggesting that a component of it was assay dependent. Variability between kit lots and between laboratories both had a major influence on amyloid beta 1-42 measurements, but for total tau and phosphorylated tau, between-kit lot effects were much less than between-laboratory effects. Despite the measurement variability, the between-laboratory consistency in classification of samples (using prehoc-derived cutoffs for AD) was high (>90% in 15 of 18 samples for ELISA and in 12 of 18 samples for xMAP).
Conclusions: The overall variability remains too high to allow assignment of universal biomarker cutoff values for a specific intended use. Each laboratory must ensure longitudinal stability in its measurements and use internally qualified cutoff levels. Further standardization of laboratory procedures and improvement of kit performance will likely increase the usefulness of CSF AD biomarkers for researchers and clinicians.
Copyright © 2013 The Alzheimer's Association. Published by Elsevier Inc. All rights reserved.
Figures


 provided data for three rounds, but on review it was found that they were all analyzed at the same time point, which may contribute to a strong bias. The remaining laboratories, indicated by special symbols, provided data for five to nine rounds. ELISA, enzyme-linked immunosorbent assay; Aβ, amyloid beta; T-tau, total tau; P-tau, phosphorylated tau.
References
-
- Vandermeeren M, Mercken M, Vanmechelen E, Six J, van de Voorde A, Martin JJ, et al. Detection of tau proteins in normal and Alzheimer’s disease cerebrospinal fluid with a sensitive sandwich enzyme-linked immunosorbent assay. J Neurochem. 1993;61:1828–34. - PubMed
-
- Blennow K, Wallin A, Agren H, Spenger C, Siegfried J, Vanmechelen E. Tau protein in cerebrospinal fluid: a biochemical marker for axonal degeneration in Alzheimer disease? Mol Chem Neuropathol. 1995;26:231–45. - PubMed
-
- Motter R, Vigo-Pelfrey C, Kholodenko D, Barbour R, Johnson-Wood K, Galasko D, et al. Reduction of beta-amyloid peptide42 in the cerebrospinal fluid of patients with Alzheimer’s disease. Ann Neurol. 1995;38:643–8. - PubMed
-
- Dubois B, Feldman HH, Jacova C, Cummings JL, Dekosky ST, Barberger-Gateau P, et al. Revising the definition of Alzheimer’s disease: a new lexicon. Lancet Neurol. 2010;9:1118–27. - PubMed
-
- Albert MS, DeKosky ST, Dickson D, Dubois B, Feldman HH, Fox NC, et al. The diagnosis of mild cognitive impairment due to Alzheimer’s disease: recommendations from the National Institute on Aging–Alzheimer’s Association workgroups on diagnostic guidelines for Alzheimer’s disease. Alzheimers Dement. 2011;7:270–9. - PMC - PubMed
Publication types
MeSH terms
Substances
Grants and funding
LinkOut - more resources
Full Text Sources
Other Literature Sources
Medical

