. 2013 May 9;153(4):747-58.
doi: 10.1016/j.cell.2013.04.008. Epub 2013 Apr 25.

Betatrophin: a hormone that controls pancreatic β cell proliferation

Affiliations

Betatrophin: a hormone that controls pancreatic β cell proliferation

Peng Yi et al. Cell. .

Retraction in

Abstract

Replenishing insulin-producing pancreatic β cell mass will benefit both type I and type II diabetics. In adults, pancreatic β cells are generated primarily by self-duplication. We report on a mouse model of insulin resistance that induces dramatic pancreatic β cell proliferation and β cell mass expansion. Using this model, we identify a hormone, betatrophin, that is primarily expressed in liver and fat. Expression of betatrophin correlates with β cell proliferation in other mouse models of insulin resistance and during gestation. Transient expression of betatrophin in mouse liver significantly and specifically promotes pancreatic β cell proliferation, expands β cell mass, and improves glucose tolerance. Thus, betatrophin treatment could augment or replace insulin injections by increasing the number of endogenous insulin-producing cells in diabetics.


Figures

Figure 1
Figure 1. Administration of the insulin receptor antagonist S961 induces glucose intolerance, hyperglycemia and hyperinsulinemia
(A) Continuous treatment of male C57BL/6J mice for 7 days with S961 at different dosages induces hyperglycemia. The fed glucose level is measured daily after pump implantation. n=4 for each dosage group. (B) Glucose tolerance test at the end of a one-week treatment with S961 (10nMol/week) shows glucose intolerance. n=4 for each group. (C) Area Under Curve (AUC) for the glucose tolerance test shown in B. (D) Continuous treatment of S961 by an osmotic pump, at different doses, induces hyperinsulinemia. n=4 for each dosage group. (* indicates that p<0.05, and ** indicates that p<0.005 compared to vehicle treatment). Data are represented as mean +/− SEM.
Figure 2
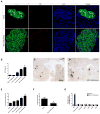
Figure 2. Administration of the insulin receptor antagonist S961 induces pancreatic β cell proliferation and β cell mass expansion
(A) S961 infused into adult mice at 10nMol/week for one week induces pancreatic β cell proliferation (shown by co-staining of Ki67 and insulin. (B) Proliferation rates of pancreatic β cells measured as percentage of dividing β cells, 7 days after S961 treatment at different doses. S961 treatment significantly increases β cell area shown by insulin immunohistochemistry (brown) (representative sections shown in C, D; β cell area as a percentage of total pancreas area in E). (n=4 in each dosage group.) (F) Total pancreatic insulin content (normalized by total protein content) in vehicle or S961 (10nMol/week) treated mice (n=3 in each group). (G) Replication rates are measured as % of cells staining for Ki67 and shown as fold increase over vehicle treatment. β cells (Ins), non-β-cell endocrine cells (Gcg+Sst+Ppy), exocrine cells, pancreatic duct cells as well as liver, white fat and brown fat after treatment of S961(10nMol/week) or vehicle treatment. n=5 for each dosage group. (* indicates that p<0.05, and ** indicates that p<0.005 compared to vehicle treatment). Data are represented as mean +/− SEM. See also Figure S1, Figure S2 and Figure S3.
Figure 3
Figure 3. Identification and expression of betatrophin
(A) Microarray analysis of livers (n=4 for each group) following one week S961 (10nMol/week) or vehicle treatment. Candidate genes with at least a 3 fold difference compared to control were chosen. The red dot is betatrophin. (B) Relative expression of betatrophin mRNA by microarray analysis in liver, white fat, skeletal muscle and β cells in S961 (10nMol/week) vs. vehicle treated mice (one week treatment, n=4 in each group except S961 treated β cells (n=3); normalized by average RNA expression level in each sample). (C) Relative expression of betatrophin by real-time PCR analysis in mouse organs/tissues, normalized by total RNA input. (D) Relative expression of betatrophin by real-time PCR analysis in various human tissues, normalized by total RNA input. (E) Real-time PCR analysis of betatrophin in liver and white fat samples from S961 (10nMol/week) or vehicle treated mice (7 days treatment, n=5 in each group.), livers from C57BL/6J (n=4), ob/ob (n=4) and db/db (n=4) male mice (F) and livers from C57BL/6J female mice at different gestational stages (n=3 in each group) (G). dpc is date post conception. (* indicates that p<0.05, and ** indicates that p<0.005 compared to vehicle treatment or wild type animals). Data are represented as mean +/− SEM. See also Figure S4.
Figure 4
Figure 4. Betatrophin encodes a secreted protein
(A) Predicted domains of the betatrophin protein. Cellular localization of mbetatrophin-Myc (B) or hbetatrophin-Myc protein (C) when transfected into the liver cell line Hepa1-6. Cellular localization of mbetatrophin-Myc (D) or hbetatrophin-Myc (E) when overexpressed in mouse liver through hydrodynamic tail vein injection. Western blots show mbetatrophin-Myc protein (F) or hbetatrophin-Myc (G) in the supernatant following gene transfection into 293T cells. GFP gene transfection and the intracellular GAPDH protein are used as controls. Western blots show mbetatrophin-Myc (H) or hbetatrophin-Myc (I) protein in plasma (3 days after injection) when the gene is overexpressed in mouse liver by hydrodynamic tail vein injection. GFP gene injection is the negative control. (J) Western blot of human betatrophin in human liver and plasma samples. Cell lysate of hbetatrophin-Myc transfected 293T cells is the positive control and cell lysate of GFP transfected 293T cells is the negative control.
Figure 5
Figure 5. Overexpression of betatrophin in the liver leads to a specific pancreatic β cell proliferation
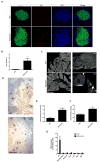
Expression of betatrophin in mouse liver by hydrodynamic tail vein injection of mbetatrophin-myc DNA strongly stimulates β cell replication compared to the similarly injected control (DNA encoding GFP) (A). (B) Quantification of the Ki67+/insulin+ ratio shows that betatrophin injected mice (n=7) have a 17 fold higher rate of β cell replication compared to controls (GFP, n=5). (C) Two representative low magnification images of pancreatic sections from mice injected with plasmids encoding GFP or betatrophin. Immunofluorescence of replicating cells (Ki67) seen as white dots; the outline of the β cell area is based on insulin staining (not shown). Note the absence of significant replication in the exocrine tissue. (D) Expansion of β cell area in mice expressing betatrophin compared to GFP controls as shown by insulin immunohistochemistry (shown in brown). (E) Quantification of β cell area/total pancreas area in mice injected with betatrophin (n=7) or control plasmids (GFP, n=5). (F) Total pancreatic insulin content (normalized by total protein content) in GFP or betatrophin injected mice (n=3 for the GFP group and n=4 for the betatrophin group). (G) The replication rates (fold over GFP control) in pancreatic β cells (Ins+), non-β-cell endocrine cells (Gcg+Sst+Ppy), exocrine cells, duct cells as well as liver, white fat and brown fat after betatrophin injection (n=5) or GFP injection (n=5). (* indicates that p<0.05, and ** indicates that p<0.005 compared to control injected animals). Data are represented as mean +/− SEM. See also Figure S2, Figure S3 and Figure S5.
Figure 6
Figure 6. Overexpression of betatrophin in the liver leads to improved β cell function
(A) Glucose tolerance test in GFP (n=5) or betatrophin (n=7) expressing mice shows a lower fasting blood glucose and an improved glucose tolerance induced by betatrophin expression. (B) Area Under Curve (AUC) for the glucose tolerance test Shown in A. (C) Fasting plasma insulin measurement in GFP (n=5) or betatrophin (n=7). (D) Insulin tolerance tests on GFP (n=5) or betatrophin (n=4) expressing mice show no sign of insulin resistance, in contrast to S961 (10nMol/week) treated animals (n=5), which show severe insulin resistance. (* indicates that p<0.05, and ** indicates that p<0.005 compared to control injected animals). Data are represented as mean +/− SEM. See also Figure S6.

Comment in

Similar articles

Cited by

References

    1. Alonso LC, Yokoe T, Zhang P, Scott DK, Kim SK, O’Donnell CP, Garcia-Ocana A. Glucose infusion in mice: a new model to induce beta-cell replication. Diabetes. 2007;56:1792–1801. - PMC - PubMed
    1. Bernard C, Thibault C, Berthault MF, Magnan C, Saulnier C, Portha B, Pralong WF, Penicaud L, Ktorza A. Pancreatic beta-cell regeneration after 48-h glucose infusion in mildly diabetic rats is not correlated with functional improvement. Diabetes. 1998;47:1058–1065. - PubMed
    1. Bock T, Pakkenberg B, Buschard K. Increased islet volume but unchanged islet number in ob/ob mice. Diabetes. 2003;52:1716–1722. - PubMed
    1. Bonner-Weir S, Deery D, Leahy JL, Weir GC. Compensatory growth of pancreatic beta-cells in adult rats after short-term glucose infusion. Diabetes. 1989;38:49–53. - PubMed
    1. Bruning JC, Winnay J, Bonner-Weir S, Taylor SI, Accili D, Kahn CR. Development of a novel polygenic model of NIDDM in mice heterozygous for IR and IRS-1 null alleles. Cell. 1997;88:561–572. - PubMed

Publication types

MeSH terms

Associated data