. 2013 May 9;153(4):882-95.
doi: 10.1016/j.cell.2013.04.006. Epub 2013 Apr 25.

Four-dimensional imaging of E. coli nucleoid organization and dynamics in living cells

Affiliations

Four-dimensional imaging of E. coli nucleoid organization and dynamics in living cells

Jay K Fisher et al. Cell. .

Abstract

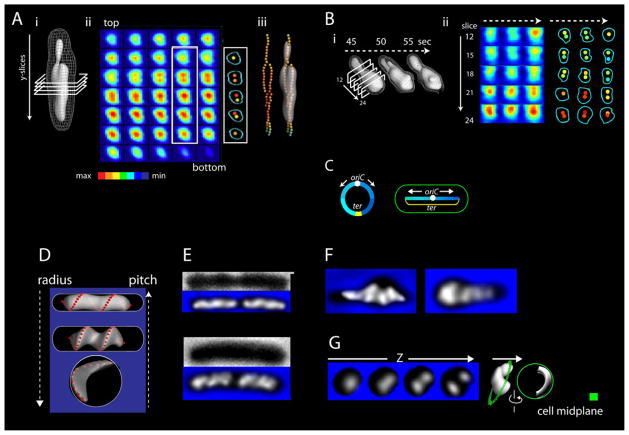
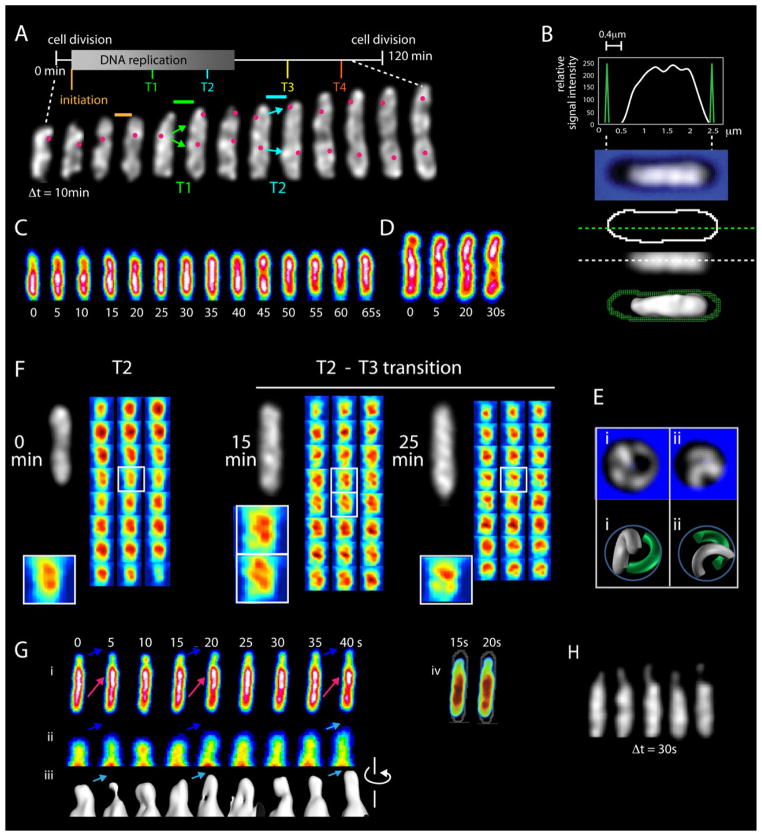
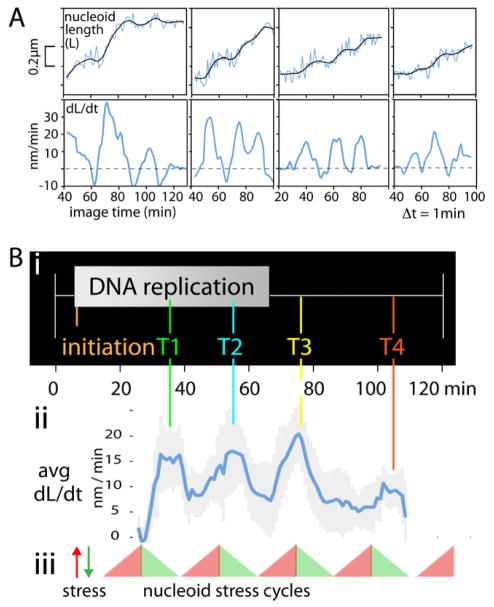
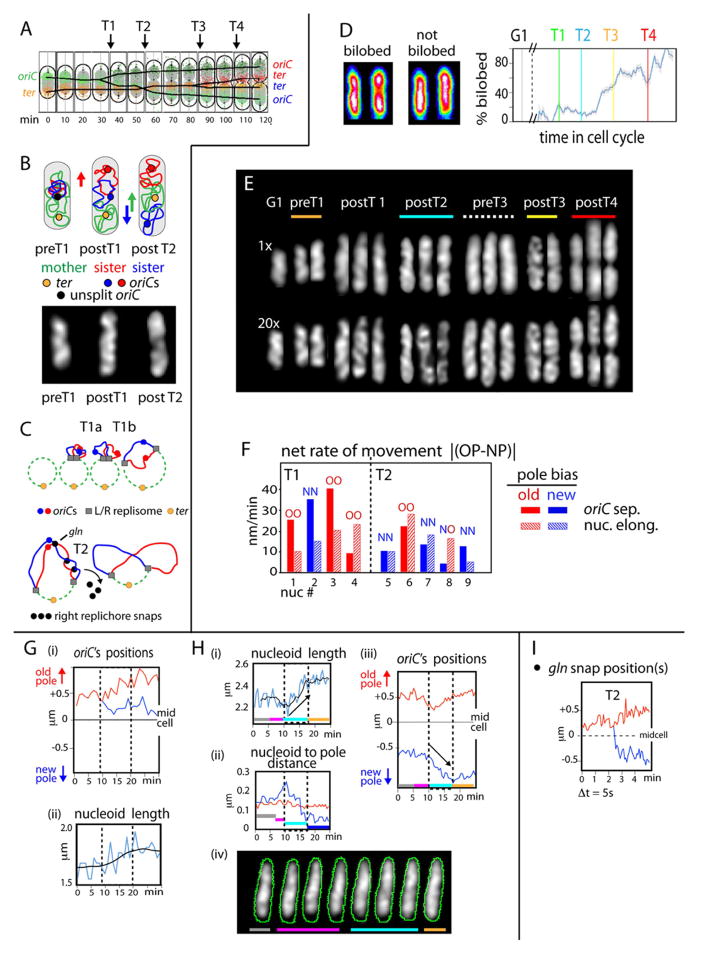
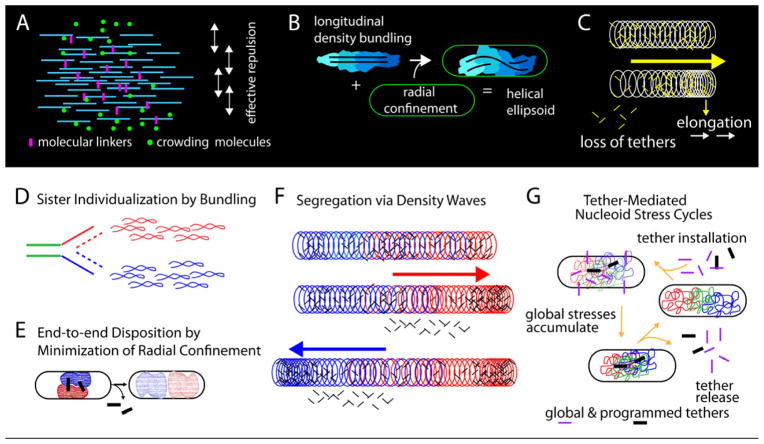
Visualization of living E. coli nucleoids, defined by HupA-mCherry, reveals a discrete, dynamic helical ellipsoid. Three basic features emerge. (1) Nucleoid density coalesces into longitudinal bundles, giving a stiff, low-DNA-density ellipsoid. (2) This ellipsoid is radially confined within the cell cylinder. Radial confinement gives helical shape and directs global nucleoid dynamics, including sister segregation. (3) Longitudinal density waves flux back and forth along the nucleoid, with 5%-10% of density shifting within 5 s, enhancing internal nucleoid mobility. Furthermore, sisters separate end-to-end in sequential discontinuous pulses, each elongating the nucleoid by 5%-15%. Pulses occur at 20 min intervals, at defined cell-cycle times. This progression includes sequential installation and release of programmed tethers, implying cyclic accumulation and relief of intranucleoid mechanical stress. These effects could comprise a chromosome-based cell-cycle engine. Overall, the presented results suggest a general conceptual framework for bacterial nucleoid morphogenesis and dynamics.


Figures

Figure 1
Figure 1
The G1 nucleoid is a discrete, but dynamic, helical ellipsoid. (A) Top: Normally growing E. coli cells were imaged in microfluidic chambers, held in place by gentle hugging in the Z-dimension, with fluid flowing around both sides. Bottom: The cell periphery, nucleoid and desired FROS foci (here marking oriC) were imaged by phase contrast and wide-field epifluorescence, in 3D, via collection of successive Z-stacks over < 2s. (B) Z-stack of HupA- mCherry images; nucleoid dimensions are 1.64μm by 0.48μm. (C) Iso-intensity PyMOL reconstruction of a G1 nucleoid, alone and with cell midplane outline (total signal (blue) and 50% and 20% of total signal (red and white)). The helical ellipsoid fills the cell radially but does not contact the cell at its new pole end. Radially-decreasing signal intensity suggests radially-decreasing density, subject to imaging resolution limits. (D) Iso-intensity reconstructions and longitudinal density centroid paths for three nucleoids; curvature handedness of curvature in red and green. Left-most nucleoid is that in (B). (E–H) Dynamic shape changes via longitudinal density waves in a single nucleoid imaged at 5s intervals. (E) 3D iso-intensity shape reconstructions. (F) Nucleoid intensities were summed by projection in the Z-dimension (left). Color map representations (right) reveal rapid longitudinal fluxes of density over distances comparable to nucleoid length. (G) Nucleoid intensities of cross-sectional slices along the length of the nucleoid (percentage of total intensity as a function of slice position), at the indicated time points (i, ii, iv). (iii) For pairs of time points, the difference in intensity at each position/slice is calculated and absolute values of these differences summed for all slices. (H) The nucleoid in (E–G) in relationship to its cell midplane at the beginning and end of the time series. Green shapes are the cell periphery in the midplane section of the corresponding phase contrast image; ivory shapes are suitably-oriented iso-intensity reconstructions. Flat bottom end to cell outline reflects close juxtaposition to its sister cell; the junction was approximated by a straight line. All images from 1× deconvolved data.
Figure 2
Figure 2
Nucleoid substructure comprises dual longitudinal density bundles. (A) Cross-sections of a G1 nucleoid (i) displayed in a color-coded array (ii). Dual longitudinal density bundles are revealed. Central densities occur along the nucleoid in continuous paths with a tendency for relational coiling (iii). (B) Bundle patterns change position, intensity and extent of duality in accord with changes in nucleoid shape as seen at 5s intervals. (C) Most of the E. coli G1 genome is arrayed linearly from one end of the cell to another, with the ~300kb terminus region stretched between the two nucleoid ends. Thus, G1 duality is not genomically specified. Images in (A,B) from 1x deconvolved data. (D–G) A change in cell radius results in a concomitant change in nucleoid helical radius and an inverse change in nucleoid helical pitch. (D) Predictions expected for a longitudinally stiff ellipsoid that is deformed into a helical shape by radial confinement. (E–G) Variations that match the predictions in (D) are observed in three cases. (E) Two different living cell types. (F) 100min growth in the presence of cell wall synthesis inhibitor mecillinam causes rounding up of cells at their (emerging) poles with changes in helical parameters in the expanded region. (G) 10min after spheroplasting by cell wall removal yields open low-pitch crescents. Images (E–G) are from 20x deconvolved data to emphasize shape.
Figure 3
Figure 3
Post-G1 nucleoids. (A–F) Basic features of G1 nucleoids also occur at later stages. (A) A single nucleoid imaged at 10min intervals reveals progressively evolving helix-like shapes with radius and pitch analogous to those at G1. Four transitions (T1–T4; below). Diagnostic origin movements at T1 and T2 are documented by concomitant imaging of oriC. Fully individualized sister nucleoids emerge only at the very end of the cell cycle (after completion of this imaging series). (B) Post-G1 nucleoids fill the cell radially but often, as in this case, do not come close to the old pole end of the cell (as in Figure 1C; also Figure S2). (C, D) Longitudinal density waves occur during DNA replication (C) and after completion of replication (D) (as in Figure 1F; quantification in Figure S3B). (E) Spheroplasting of a late-stage cell creates low pitch crescents (as in Figure 2G; Z-series in Figure S4). Maximal separation implies a tendency for non-intermingling. (F) Longitudinal density bundle patterns (as in Figure 2A, B) for the same nucleoid at successive times in the T2 to T3 period, showing duality (left), a multiple-bundled state (middle), and a peculiar mid-cell pattern (right). The latter two morphologies are not seen in G1 nucleoids. (G) Elongation of a post-G1 nucleoid seen by imaging at 5s intervals. Z-projections illustrate protrusion of nucleoid density into empty space at the old pole end of the cell (blue arrows in i, ii) with accompanying longitudinal density waves that move up and back through the shape in the same direction (i; red arrows) analogously to an incoming tide. Iso-intensity PyMOL thresholding of the same nucleoid (iii) reveals dual longitudinal density bundles in tightly juxtaposed or open states. Variations in thickness reveal incorporation of fluxing density into the shape. (iv) 3D PyMOL rendering of the same nucleoid illustrating protrusion of density into nucleoid-free space at the old cell pole. (H) Mid-plane images, taken at 30 sec intervals, of a nucleoid exhibiting a long thin protruding finger that is curving around the radial cell periphery with concomitant density fluxes. All images from 1x deconvolved data.
Figure 4
Figure 4
The nucleoid elongates in 10min pulses at defined 20min intervals during the cell cycle. (A) Lengths of four individual nucleoids, imaged at successive 1min intervals, show pulses of increase, usually immediately preceded by a short period of nucleoid shortening, as seen in primary length curves (top) and rates of increase given by the slopes of those curves (bottom). In contrast, cell length increases monotonically throughout (Figure S6). (B) (i, ii) Averaging of rate increases for multiple data sets (N=14) reveals that pulses of length increase occur at 20min intervals, at specific times through the analyzed period of the cell cycle, in temporal correlation with the times of the T1–T4 transitions. (iii) Pulses could correspond to periodic accumulation and release of nucleoid stress.
Figure 5
Figure 5
Nucleoid elongation pulses correspond to global increases in sister separation. (A) T1–T4 transitions as previously-described (Bates and Kleckner 2005; Joshi et al., 2011; text). (B) Top: model for spatial evolution of sister and mother regions via T1 and T2 transitions (Joshi et al., 2011). Bottom: matching whole nucleoid images occur at appropriate stages. (C) Programmed tethers that modulate T1 and T2 (Joshi et al., 2011; text). (D) Bilobed character was defined for >1000 nucleoids from known times throughout the cell cycle by analysis of longitudinal density distributions in Z-projections. Left: examples of bilobed and non-bilobed states. Right: Frequency of nucleoids showing bilobed character increases in discrete steps at the T1–T4 transitions. (E) Pronounced nucleoid morphologies characteristic of the indicated stages. Midplanes from 1x deconvolved and 20x deconvolved images (top and bottom). (F) Sister oriCs usually exhibit differential separation towards the old pole (filled red bars) and new pole (filled blue bars) at the T1 and T2 transitions, respectively. Y-axis = Δ = |(rate of increase towards old pole - rate of increase towards new pole)|. Bias is more pronounced at T1 vesus T2: Δ = 28nm/min (+/− 1.4) and 12nm/min (+/− 6.5) respectively. Concomitant nucleoid length increases (hatched bars) occur differentially in the same direction as oriC movement in 4/4 T1 nucleoids and 4/5 T2 nucleoids. (G) A T1 nucleoid imaged at 1min intervals. oriC separates differentially towards the old pole (i) during a pulse of nucleoid length increase (ii) that also occurs preferentially towards the old pole end of the cell (not shown). (H) A T2 nucleoid, imaged at 30s intervals. (i) A pulse of length increase (turquoise) preceded by a period of nucleoid shortening (pink). (ii) Nucleoid length increases towards the new pole end of the cell (turquoise). (iii) Concomitant differential movement of the midcell sister oriC towards the new pole end at 50nm/min (turquoise). (I) Separation of sisters at the T2 “snap” locus gln, defined by 2D imaging at 5s intervals. Loci separate at approximately 380nm/min, significantly faster than oriC splitting at T1 or T2.
Figure 6
Figure 6
E. coli nucleoid shape, organization and dynamics. (A) Longitudinal density bundles could comprise sub-bundles (e.g. supercoiled plectonemes). Association via weak forces, to permit ready adjustment, could reflect molecular crowding and/or weak- binding linker proteins. Associative effects of bundling could be opposed by an effective repulsion to give low DNA density. (B) Longitudinal density bundles create ellipsoid shape that is helically deformed by interaction with the cell periphery (radial confinement). (C) Longitudinal density waves tend to promote release of tethers at the lagging end. Given directionality, they can underlie elongation at the leading end. (D–F) Sister segregation without a spindle. ( D ) Genomically-biased longitudinal bundling promotes individualization of sisters into distinct units. (E) Minimization of radial confinement stress promotes placement of sister units in an end-to-end disposition versus other relationships. (F) The back and forth motion of density waves facilitate sister segregation by “greasing” the system, removing constraining linkages to increase mobility. (G) Global tether-mediated nucleoid stress cycles (text).

Comment in

Similar articles

Cited by

References

    1. Adams M, Fraden S. Phase behavior of mixtures of rods (tobacco mosaic virus) and spheres (polyethylene oxide, bovine serum albumin) Biophys J. 1998;74:669–677. - PMC - PubMed
    1. Banigan EJ, Gelbart MA, Gitai Z, Wingreen NS, Liu AJ. Filament depolymerization can explain chromosome pulling during bacterial mitosis. PLoS Comput Biol. 2011;7:e1002145. - PMC - PubMed
    1. Bates D. The bacterial replisome: back on track? Mol Microbiol. 2008;69:1341–1348. - PMC - PubMed
    1. Bates D, Kleckner N. Chromosome and replisome dynamics in E. coli: Loss of sister cohesion triggers global chromosome movement and mediates chromosome segregation. Cell. 2005;121:1–13. - PMC - PubMed
    1. Bates D, Epstein J, Boye E, Fahrner K, Berg H, Kleckner N. The Escherichia coli baby cell column: a novel cell synchronization method provides new insight into the bacterial cell cycle. Mol Microbiol. 2005;57:380–391. - PMC - PubMed

Publication types