. 2013 Jun;109(2):161-70.
doi: 10.1016/j.ymgme.2013.03.018. Epub 2013 Apr 6.

Pathogenesis of growth failure and partial reversal with gene therapy in murine and canine Glycogen Storage Disease type Ia

Affiliations

Pathogenesis of growth failure and partial reversal with gene therapy in murine and canine Glycogen Storage Disease type Ia

Elizabeth Drake Brooks et al. Mol Genet Metab. 2013 Jun.

Abstract

Glycogen Storage Disease type Ia (GSD-Ia) in humans frequently causes delayed bone maturation, decrease in final adult height, and decreased growth velocity. This study evaluates the pathogenesis of growth failure and the effect of gene therapy on growth in GSD-Ia affected dogs and mice. Here we found that homozygous G6pase (-/-) mice with GSD-Ia have normal growth hormone (GH) levels in response to hypoglycemia, decreased insulin-like growth factor (IGF) 1 levels, and attenuated weight gain following administration of GH. Expression of hepatic GH receptor and IGF 1 mRNAs and hepatic STAT5 (phospho Y694) protein levels are reduced prior to and after GH administration, indicating GH resistance. However, restoration of G6Pase expression in the liver by treatment with adeno-associated virus 8 pseudotyped vector expressing G6Pase (AAV2/8-G6Pase) corrected body weight, but failed to normalize plasma IGF 1 in G6pase (-/-) mice. Untreated G6pase (-/-) mice also demonstrated severe delay of growth plate ossification at 12 days of age; those treated with AAV2/8-G6Pase at 14 days of age demonstrated skeletal dysplasia and limb shortening when analyzed radiographically at 6 months of age, in spite of apparent metabolic correction. Moreover, gene therapy with AAV2/9-G6Pase only partially corrected growth in GSD-Ia affected dogs as detected by weight and bone measurements and serum IGF 1 concentrations were persistently low in treated dogs. We also found that heterozygous GSD-Ia carrier dogs had decreased serum IGF 1, adult body weights and bone dimensions compared to wild-type littermates. In sum, these findings suggest that growth failure in GSD-Ia results, at least in part, from hepatic GH resistance. In addition, gene therapy improved growth in addition to promoting long-term survival in dogs and mice with GSD-Ia.


Conflict of interest statement

Conflict of interest statement The authors have no conflicts of interest to report with regard to this work.

Supplementary data to this article can be found online at http://dx.doi.org/10.1016/j.ymgme.2013.03.018.

Figures

Fig. 1
Fig. 1
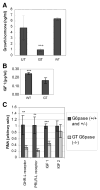
Decreased GH, IGF 1, and hepatic receptors for GH, prolactin and IGF 1 in G6pase (−/−) mice. (A) Randomly sampled plasma growth hormone in G6pase (−/−) mice, either untreated (UT; n = 3) or glucose treated (GT; n = 4) and for G6pase (+/+) littermates (WT; n = 3). (B) Plasma IGF 1 for WT mice and for GT G6pase (−/−) mice at 2 weeks of age (n = 3 in each group). (C) Realtime RT-PCR analysis of liver RNA from 13 +/− 1-day-old G6pase (−/−) and unaffected G6pase (+/+ and +/−) littermates for the GH receptor (GHR-L) and prolactin receptor (PRLR-L) (n = 4 in each group), and for IGF 1 and IGF 2 RNAs (n = 3 for each group) in the liver of GT G6pase (−/−) and WT mice, units are normalized to β-actin. Mean +/− standard deviation shown. ** = p < 0.01, *** = p < 0.001 (as determined by two-tailed homoscedastic Student's t-test).
Fig. 2
Fig. 2
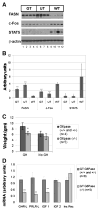
GH signaling pathway in G6pase (−/−) liver.(A) Western blot detection of fatty acid synthase (FASN), c-Fos, and STAT5 in glucose-treated (GT)G6pase (−/−) mouse and G6pase (+/+) mouse (WT) liver at 13 +/− 1 days of age. Each lane represents an individual mouse. (B) Quantification of the indicated proteins by densitometry of Western blot images, normalized to β-actin. The normalized signals for GT, UT, and WT mouse liver are shown (mean +/− SD). (C) Body weight at 10 days of age for GH treated and untreated mice. Groups were unaffected, (G6pase (+/−) and G6pase (+/+), (n = 4) and affected, G6pase (−/−), (n = 5) mice. (D) Realtime RT-PCR analysis of liver RNA from 13 +/− 1-day-old G6pase (−/−)(n = 8) and both G6pase (+/−) and G6pase (+/+) mice (n = 8) following glucose and GH treatment (GT) for growth hormone receptor (GHR-L), prolactin receptor (PRLR-L), IGF 1, IGF 2, and insulin receptor (Ins Rec) RNA (n = 4 for each group), normalized to β-actin. Half of the mice in each group were injected with 10 μg GH for 7 days, and half of the mice were treated similarly with 25 μg daily. The responses for the two dosages were equivalent, and therefore results were pooled for the two GH treatments. * = p < 0.05; ** = p < 0.01, *** = p < 0.001 (as determined by two-tailed homoscedastic Student's t-test) for the comparisons of G6pase (−/−) mice with normal, WT or with unaffected mice. The latter group of unaffected mice included both G6pase (+/−) and G6pase (+/+) mice (see Materials and methods for further information).
Fig. 3
Fig. 3
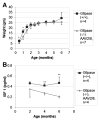
Growth and IGF 1 in G6pase (−/−) mice following AAV2/9-G6Pase vector administration. Affected mice did not survive until 1 month of age unless the AAV vector was administered. (A) Weight of G6pase (+/+)mice (n = 4) and G6pase (−/−)mice (n = 7) following administration of the AAV2/8-G6Pase vector (1 × 10¹³ vector particles/kg body weight) at 2 weeks of age. (B) Plasma IGF 1 for G6pase (+/+) and G6pase (−/−) mice (n = 4 in each group), either untreated or following AAV2/8-G6Pase vector administration, respectively. * = p < 0.05 (as determined by two-tailed homoscedastic Student's t-test).
Fig. 4
Fig. 4
Decreased growth and IGF 1 in GSD-Ia affected dogs following AAV vector administration and GSD-Ia carriers compared with wild-type littermates. Body weights were obtained during the first 7 weeks of life and at >20 months of age. Mean +/− standard deviation shown. * p < 0.05; ** p < 0.01, *** p < 0.001 (as determined by Student's t-test and one way ANOVA with Tukey analysis). (A) GSD-Ia affected animals were either treated with AAV2/9-G6Pase at 2–3 days of life or received no treatment and were managed with frequent meals and glucose administration alone. (B) Unaffected animals were littermates of GSD-Ia affected offspring and were either wild-type or heterozygous carriers of GSD-Ia. No significant difference in early weight gain in GSD-Ia carriers and wild-type dogs (p > 0.11 for all time points), therefore they were grouped together here. GSD-Ia affected animals were treated with AAV2/9-G6Pase at 2–3 days of life; n = 2–22, see Table S1. (C) Weight (kg) obtained at 20 months of age and older from GSD-Ia affected dogs treated with AAV2/9-G6Pase as neonates and their unaffected littermates, including wild-type and carriers for GSD-Ia. (D) Serum IGF 1 concentrations at 8 weeks and 22–23 weeks of age in GSD-Ia affected dogs treated with AAV2/9-G6Pase as neonates and their unaffected littermates, including wild-type and carriers for GSD-Ia; one wild-type dog was adopted prior to 20 weeks accounting for n = 1 at 22–23 weeks.
Fig. 5
Fig. 5
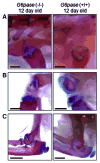
Dyschondrogenesis of G6pase (−/−) mice at 12 days of age. Alcian Blue/Alizarin Red whole limb staining of 12-day old glucose treated G6pase (−/−) mice (n = 3) and G6pase (+/+) mice (n = 3). Images representative of all animals analyzed. (A) Hip shows delay in secondary ossification in G6pase (−/−) mice. (B) Knee of G6pase (−/−) mice demonstrates severe delay in secondary ossification and malformation of distal femur and proximal tibia. (C) Elbow of G6pase (−/−) mouse demonstrates delay in ossification and deformity of proximal radius and ulna. Cartilage stains blue and bone stains red/pink. Scale bar = 1 mm. Craniad to the left of the images and proximal at the top.
Fig. 6
Fig. 6
Delayed ossification of G6pase (−/−) mice and dysplasia in AAV2/8-G6Pase vector-treated G6pase (−/−) mice. Radiographic images taken of untreated G6pase (−/−) mice (n = 3) and G6pase (+/+) mice (n = 3) at 12 days of age and AAV2/8-G6Pase vector-treated G6pase (−/−) mice with G6pase (+/+) mice at 6 months of age. Images representative of all animals analyzed. (A) Hip, (B) knee,(C) caudal vertebrae 4–6, (D) shoulder, (E) elbow, and (F) carpus demonstrate severe dysplasia and delayed secondary ossification in G6pase (−/−) mice.
Fig. 7
Fig. 7
Decreased bone dimensions in GSD-Ia affected dogs treated with AAV2/9-G6Pase compared with unaffected littermates. (A) Mediolateral radiographic view taken of forelimb at 3 months of age from a GSD-Ia male affected dog (right) treated with AAV2/9-G6Pase, his wild-type male littermate (left), and a female GSD-Ia carrier from a different litter (middle). Note a 65% difference in radius length of the GSD-Ia affected dog treated with AAV2/9-G6Pase and wild-type littermate, versus a 78% difference between GSD-Ia carrier and wild-type (see Table S3). Dogs weighed 3.9 kg (A), 3.2 kg (B) and 1.8 kg (C) at time radiographs were taken. White marker represents 15 mm. (B) Photograph of 34-month-old female GSD-Ia AAV2/9-G6Pase vector-treated dog (right) and male GSD-Ia carrier littermate (left) who weighed 8.2 kg at the time the picture was taken. (C–E) Radiographic analysis performed at 37 months of age of same female GSD-Ia AAV2/9-G6Pase treated dog (right) and a different male GSD-Ia carrier littermate (left). Dogs weighed 3.8 kg and 8.6 kg, respectively, at time of radiographs. White marker represents 15 mm. (C) Plantardorsal radiographic view of the right rear foot, metatarsals and proximal phalangeal bones of a female GSD-Ia AAV-G6Pase treated dog were approximately 88 and 87%, respectively, the length of her male GSD-Ia carrier littermate. (D) Lateral radiographic view of the femur of a female GSD-Ia AAV-G6Pase treated dog was approximately 88% the length of those of her male GSD-Ia carrier littermate, but 70% the width. (E) Ventrodorsal radiographic view of the pelvis of a female GSD-Ia AAV-G6Pase treated dog was approximately 82% and 76% the length and width, respectively, of the pelvis of her male GSD-Ia carrier littermate (see Table S4).

References

    1. Koeberl DD, Kishnani PS, Bali D, Chen YT. Emerging therapies for glycogen storage disease type I. Trends Endocrinol Metab. 2009;20:252–258. - PubMed
    1. Weinstein DA, Wolfsdorf JI. Effect of continuous glucose therapy with uncooked cornstarch on the long-term clinical course of type 1a glycogen storage disease. Eur J Pediatr. 2002;161(Suppl 1):S35–S39. - PubMed
    1. Melis D, Pivonello R, Parenti G, Della Casa R, Salerno M, Balivo F, Piccolo P, Di Somma C, Colao A, Andria G. The growth hormone-insulin-like growth factor axis in glycogen storage disease type 1: evidence of different growth patterns and insulin-like growth factor levels in patients with glycogen storage disease type 1a and 1b. J Pediatr-Us. 2010;156 (663-U198) - PubMed
    1. Rake JP, Visser G, Labrune P, Leonard JV, Ullrich K, Smit GP. Glycogen storage disease type I: diagnosis, management, clinical course and outcome. Results of the European Study on Glycogen Storage Disease Type I (ESGSD I) Eur J Pediatr. 2002;161(Suppl 1):S20–S34. - PubMed
    1. Mundy HR, Hindmarsh PC, Matthews DR, Leonard JV, Lee PJ. The regulation of growth in glycogen storage disease type 1. Clin Endocrinol. 2003;58:332–339. - PubMed

Publication types

MeSH terms

Supplementary concepts