

The role of adipocyte XBP1 in metabolic regulation during lactation
- PMID: 23623498
- PMCID: PMC3724425
- DOI: 10.1016/j.celrep.2013.03.042
The role of adipocyte XBP1 in metabolic regulation during lactation
Abstract
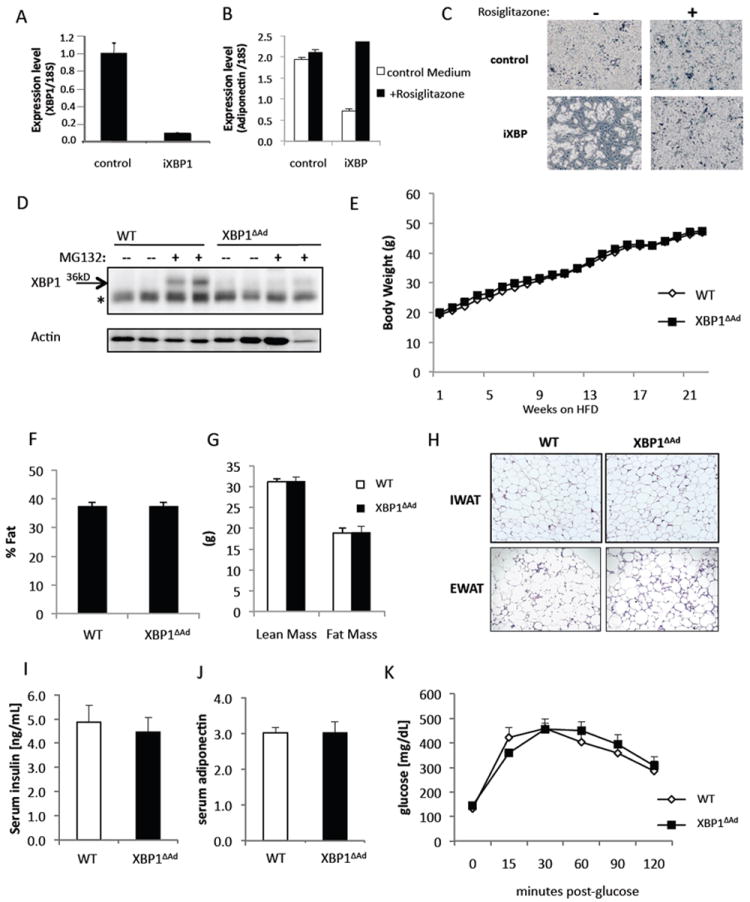
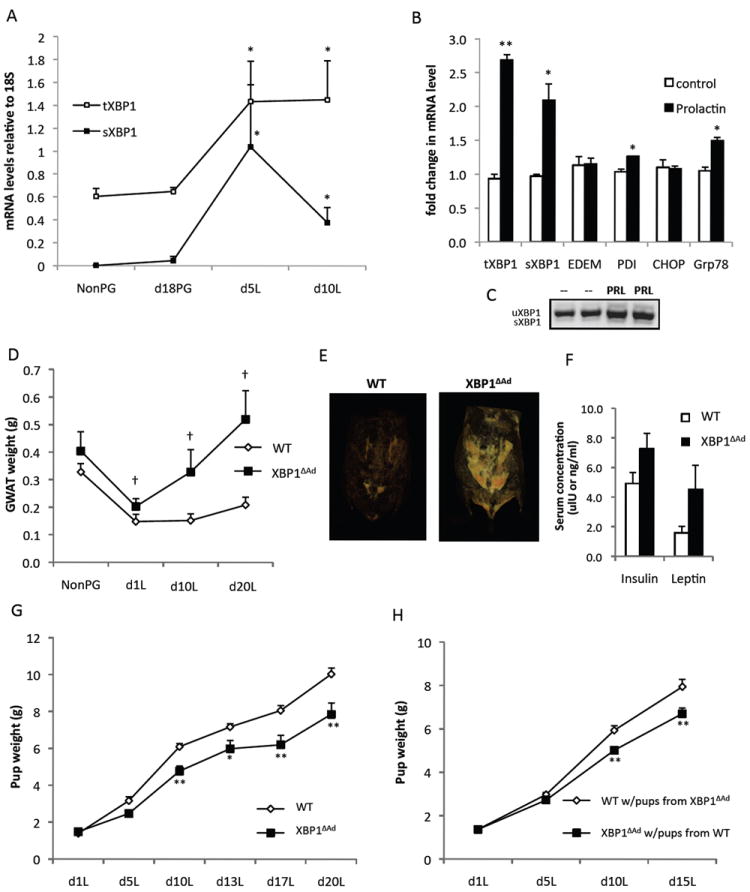
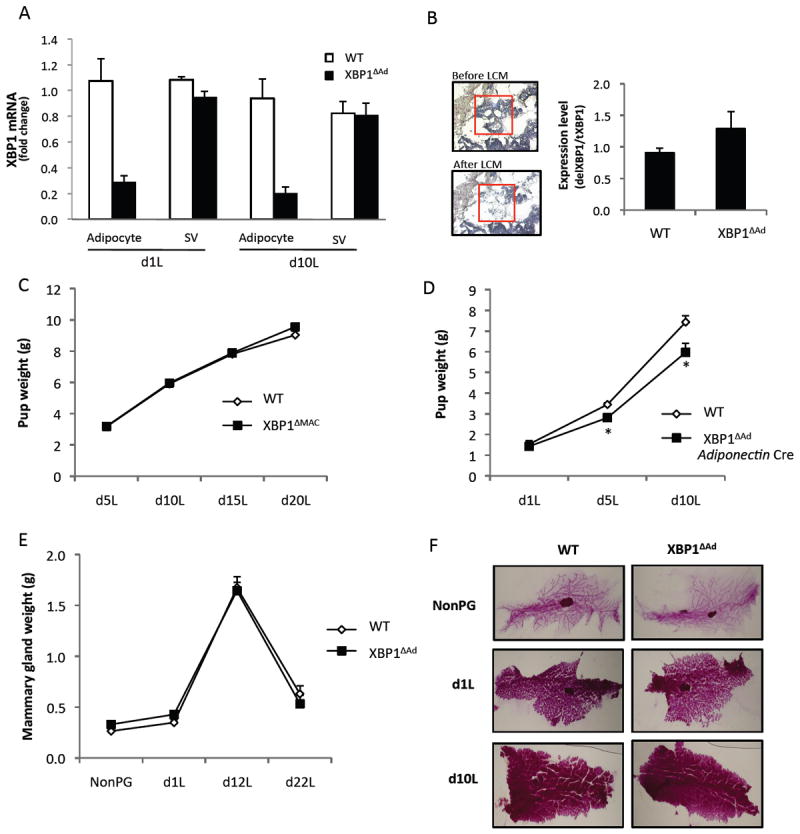
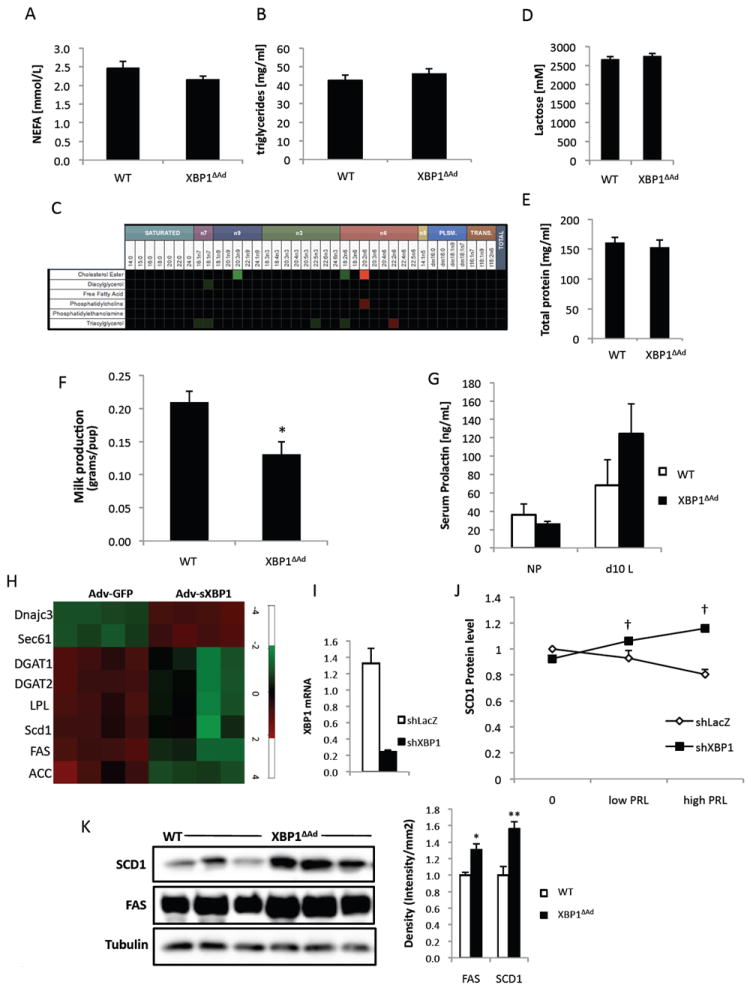
The adipocyte is central to organismal metabolism and exhibits significant functional and morphological plasticity during its formation and lifespan. Remarkable transformations of this cell occur during obesity and lactation, and thus it is essential to gain a better understanding of adipocyte function in these two metabolic processes. Considering the critical importance of the cellular organelle endoplasmic reticulum (ER) in adapting to fluctuations in synthetic processes, we explored the role of XBP1, a central regulator of ER adaptive responses, in adipocyte formation and function. Unexpectedly, deletion of adipocyte-XBP1 in vivo in mice (XBP1ΔAd) had no effect on adipocyte formation or on systemic homeostatic metabolism in mice fed a a regular or high-fat diet. However, during lactation, XBP1ΔAd dams displayed increased adiposity, decreased milk production, and decreased litter growth as compared with control dams. Moreover, we demonstrate that XBP1 is regulated during lactation and responds to prolactin to alter lipogenic gene expression. These results demonstrate a role for adipocyte-XBP1 in the regulation of lactational metabolism.
Copyright © 2013 The Authors. Published by Elsevier Inc. All rights reserved.
Figures
Similar articles
-
Epithelial Xbp1 is required for cellular proliferation and differentiation during mammary gland development.Mol Cell Biol. 2015 May;35(9):1543-56. doi: 10.1128/MCB.00136-15. Epub 2015 Feb 23. Mol Cell Biol. 2015. PMID: 25713103 Free PMC article.
-
XBP1 Regulates the Biosynthetic Capacity of the Mammary Gland During Lactation by Controlling Epithelial Expansion and Endoplasmic Reticulum Formation.Endocrinology. 2016 Jan;157(1):417-28. doi: 10.1210/en.2015-1676. Epub 2015 Nov 12. Endocrinology. 2016. PMID: 26562262
-
The chemical chaperone 4-phenylbutyrate inhibits adipogenesis by modulating the unfolded protein response.J Lipid Res. 2009 Dec;50(12):2486-501. doi: 10.1194/jlr.M900216-JLR200. J Lipid Res. 2009. PMID: 19461119 Free PMC article.
-
Variation in x-box binding protein 1 (XBP1) expression and its dependent endoplasmic reticulum chaperones does not regulate adiponectin secretion in dairy cows.J Dairy Sci. 2018 Jun;101(6):5559-5570. doi: 10.3168/jds.2017-14048. Epub 2018 Mar 15. J Dairy Sci. 2018. PMID: 29550138
-
FFA-induced adipocyte inflammation and insulin resistance: involvement of ER stress and IKKβ pathways.Obesity (Silver Spring). 2011 Mar;19(3):483-91. doi: 10.1038/oby.2010.200. Epub 2010 Sep 9. Obesity (Silver Spring). 2011. PMID: 20829802
Cited by
-
Adipocyte IRE1α promotes PGC1α mRNA decay and restrains adaptive thermogenesis.Nat Metab. 2022 Sep;4(9):1166-1184. doi: 10.1038/s42255-022-00631-8. Epub 2022 Sep 19. Nat Metab. 2022. PMID: 36123394
-
Epithelial Xbp1 is required for cellular proliferation and differentiation during mammary gland development.Mol Cell Biol. 2015 May;35(9):1543-56. doi: 10.1128/MCB.00136-15. Epub 2015 Feb 23. Mol Cell Biol. 2015. PMID: 25713103 Free PMC article.
-
Mature white adipocyte plasticity during mammary gland remodelling and cancer.Cell Insight. 2023 Aug 20;2(5):100123. doi: 10.1016/j.cellin.2023.100123. eCollection 2023 Oct. Cell Insight. 2023. PMID: 37771567 Free PMC article. Review.
-
Aberrant Ca2+ signaling by IP3Rs in adipocytes links inflammation to metabolic dysregulation in obesity.Sci Signal. 2021 Dec 14;14(713):eabf2059. doi: 10.1126/scisignal.abf2059. Epub 2021 Dec 14. Sci Signal. 2021. PMID: 34905386 Free PMC article.
-
Changes in the mammary gland during aging and its links with breast diseases.Acta Biochim Biophys Sin (Shanghai). 2023 May 15;55(6):1001-1019. doi: 10.3724/abbs.2023073. Acta Biochim Biophys Sin (Shanghai). 2023. PMID: 37184281 Free PMC article. Review.
References
-
- Bell AW, Bauman DE. Adaptations of glucose metabolism during pregnancy and lactation. J Mammary Gland Biol Neoplasia. 1997;2:265–278. - PubMed
-
- Boxer RB, Stairs DB, Dugan KD, Notarfrancesco KL, Portocarrero CP, Keister BA, Belka GK, Cho H, Rathmell JC, Thompson CB, Birnbaum MJ, Chodosh LA. Isoform-specific requirement for Akt1 in the developmental regulation of cellular metabolism during lactation. Cell Metab. 2006;4:475–490. - PubMed
Publication types
MeSH terms
Substances
Associated data
- Actions
Grants and funding
LinkOut - more resources
Full Text Sources
Other Literature Sources
Molecular Biology Databases
