. 2013 May 6;23(9):770-4.
doi: 10.1016/j.cub.2013.03.042. Epub 2013 Apr 25.

The budding yeast point centromere associates with two Cse4 molecules during mitosis

Affiliations

The budding yeast point centromere associates with two Cse4 molecules during mitosis

Pavithra Aravamudhan et al. Curr Biol. .

Abstract

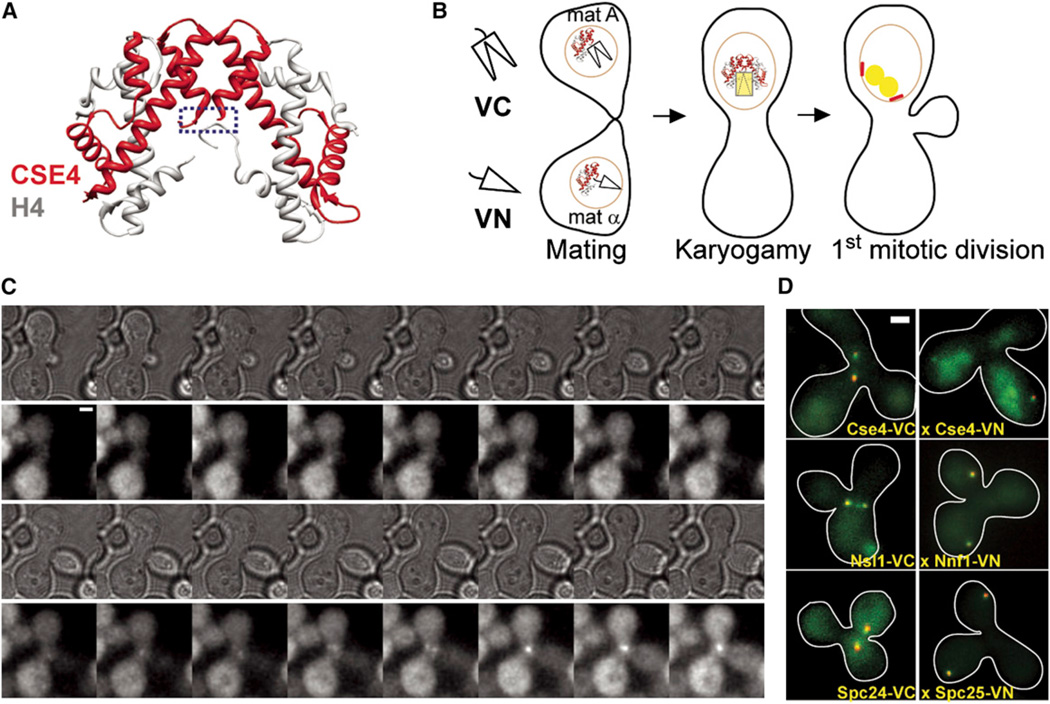
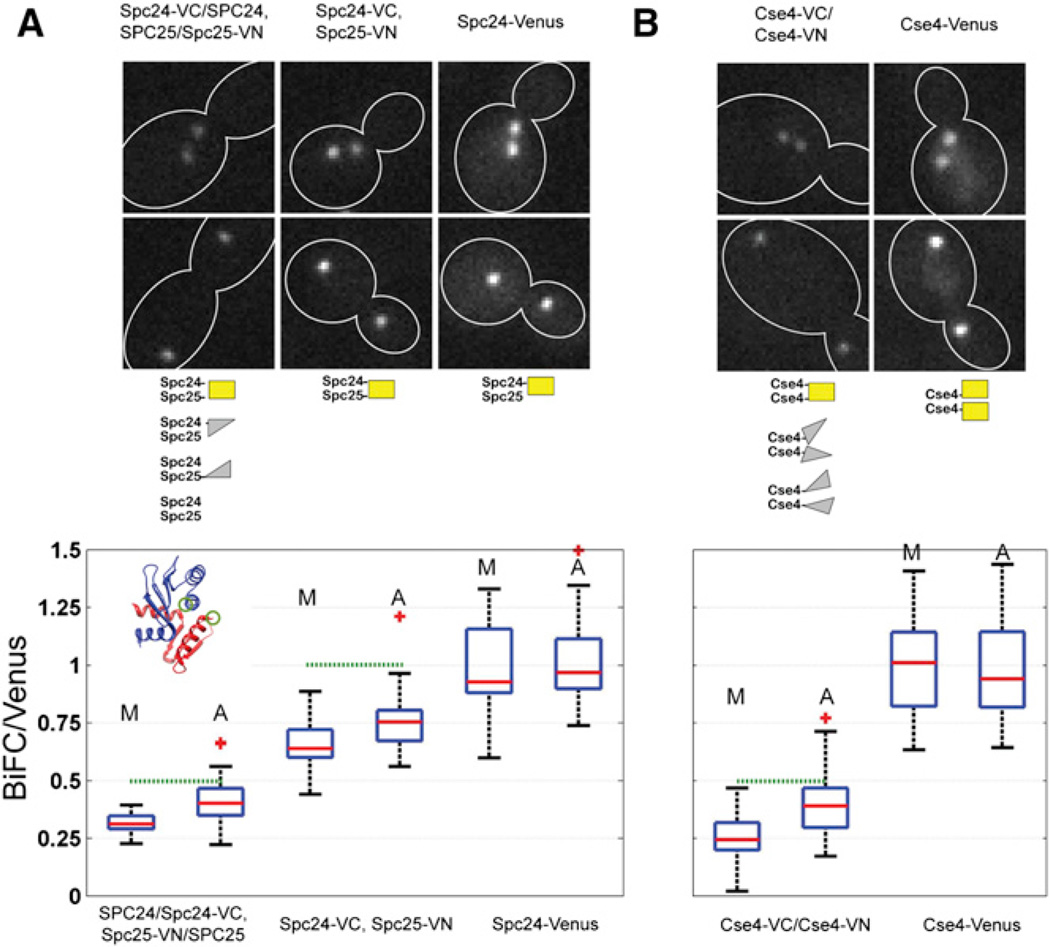
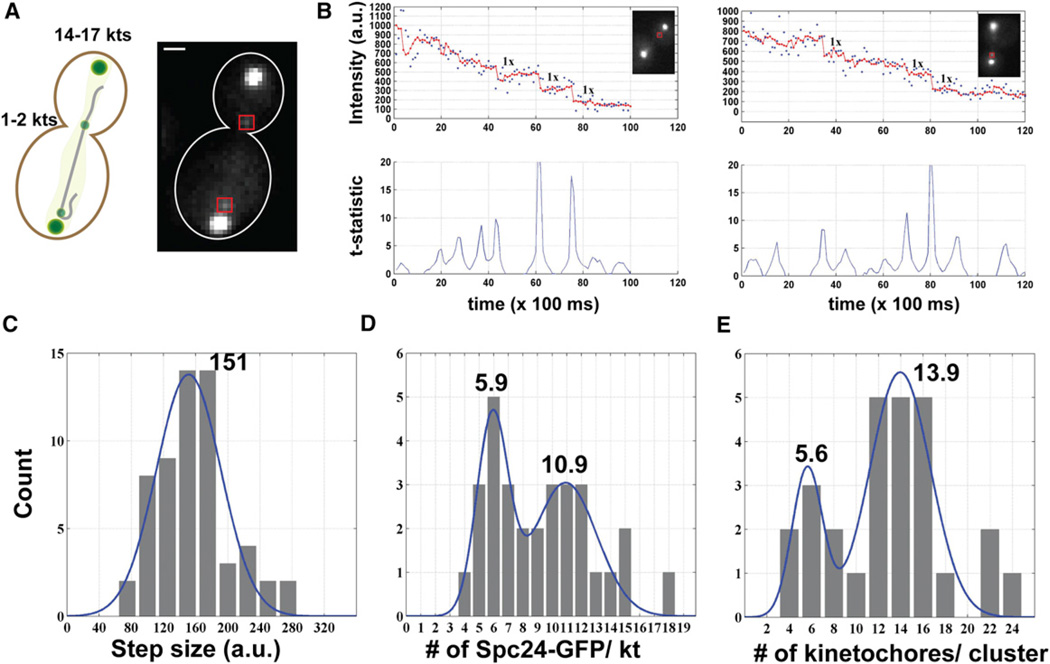
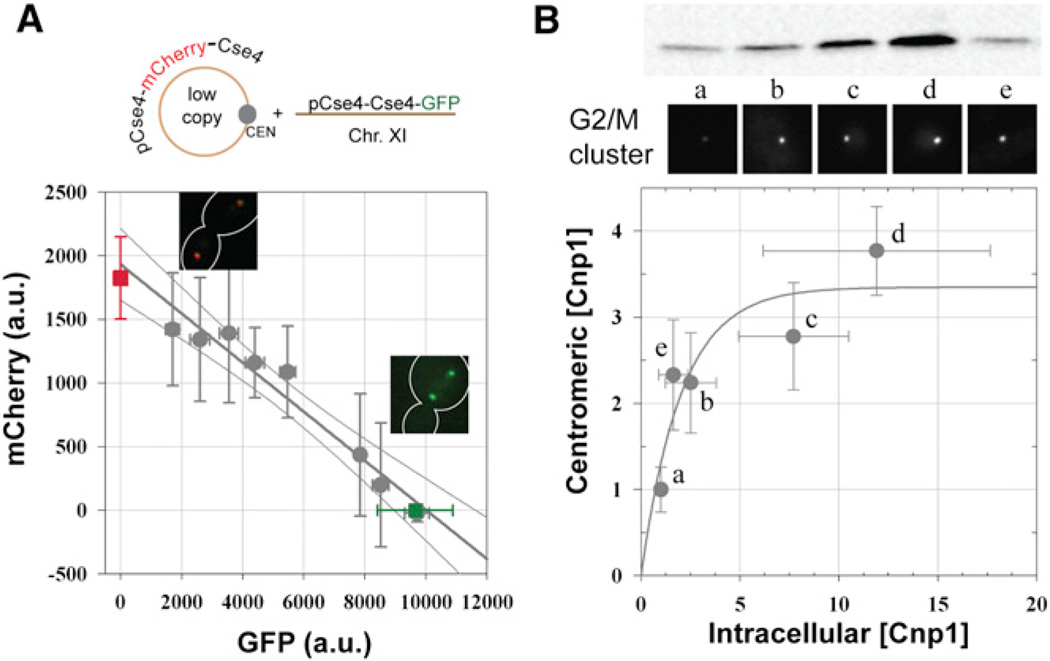
The centromere is defined by the incorporation of the centromere-specific histone H3 variant centromere protein A (CENP-A). Like histone H3, CENP-A can form CENP-A-H4 heterotetramers in vitro. However, the in vivo conformation of CENP-A chromatin has been proposed by different studies as hemisomes, canonical, or heterotypic nucleosomes. A clear understanding of the in vivo architecture of CENP-A chromatin is important, because it influences the molecular mechanisms of the assembly and maintenance of the centromere and its function in kinetochore nucleation. A key determinant of this architecture is the number of CENP-A molecules bound to the centromere. Accurate measurement of this number can limit possible centromere architectures. The genetically defined point centromere in the budding yeast Saccharomyces cerevisiae provides a unique opportunity to define this number accurately, as this 120-bp-long centromere can at the most form one nucleosome or hemisome. Using novel live-cell fluorescence microscopy assays, we demonstrate that the budding yeast centromere recruits two Cse4 (ScCENP-A) molecules. These molecules are deposited during S phase and they remain stably bound through late anaphase. Our studies suggest that the budding yeast centromere incorporates a Cse4-H4 tetramer.


Figures

Figure 1
Figure 1. More Than One Cse4 Molecule Is Deposited at the Centromere in S Phase
(A) Model of the H4-Cse4 heterotetramer shows that the carboxyl termini of the two Cse4 molecules (blue box) are separated by more than 2 nm. (B) Schematic of approach to monitor the deposition of two or more Cse4 molecules at the centromere. Mating of two haploid strains expressing Cse4-VC (carboxyl fragment of Venus) and Cse4-VN (amino fragment of Venus) is followed by karyogamy, after which the newly diploid cell enters its first mitotic division. The two Cse4-BiFC species can interact with each other only after cell fusion. Therefore, development of Venus fluorescence in the zygote relative to the mitotic spindle (demarcated by red spindle pole bodies) will indicate Cse4 deposition at the centromere. (C) Time-lapse microscopy showing the development of a single Venus fluorescence focus within the zygote after bud emergence, which coincides with entry into S phase (top panels, transmitted light images; bottom panels, maximum projection YFP images acquired every 5 min, scale bar represents ~ 2 µm). (D) Colocalization of the BiFC fluorescence with a spindle-pole body marker (either Tub4-mCherry or Spc97-mCherry) confirms that the fluorescence is associated with centromere or kinetochore clusters (scale bar ~ 0.96 µm).
Figure 2
Figure 2. High BiFC Maturation Efficiency Suggests that Every Centromere Associates with More Than One Cse4 Molecule
(A) Representative images of metaphase and anaphase cells from the Spc24-VC, Spc25-VN, and Spc24-Venus strains. The middle panel displays the possible Spc24/Spc25 dimer species. Box plot displays the relative BiFC and Venus fluorescence intensities (M, metaphase; A, anaphase). Inset shows the structure of the globular domain of the Spc24/25 dimer with the labeled carboxyl termini (green circles). The maximum attainable BiFC to Venus ratio in each case is indicated by the green dotted line. (B) Representative images of metaphase and anaphase cells from the Cse4-VC/Cse4-VN and Cse4-Venus strains. Comparison of the Cse4-BiFC signal with the signal from a haploid strain expressing Cse4-Venus. The box plots display the median with a red line, the 25th and 75th percentiles by the edges of the box, and the most extreme data points by the whiskers. Outliers are plotted individually. Note that the integration time and excitation intensity was lowered for Spc24/25 measurements. Hence, intensities should not be compared between the Cse4 and Spc24/25 panels.
Figure 3
Figure 3. Photobleaching-Assisted Counting of Kinetochore Proteins in Live Yeast Cells
(A) Conditionally dicentric chromosomes were used to create and image single lagging kinetochores, as described previously. (B) Signal intensity during continuous photobleaching of one (left) or two (right) kinetochores (blue dots, raw data; red dots, data filtered with the Chung-Kennedy filter and a window size of 5). Bottom panel displays the t-statistic used to ensure a statistical significance of p < 0.01 on all detected steps. Visually verified events were selected for further analysis. (C) Histogram of detected steps (n = 60 from 31 photobleaching experiments). When fit with a Gaussian (blue line, R2 = 0.90), the photobleaching step was found to be 151 ± 40 a.u. (D) Histogram depicting the number of Spc24-GFP molecules per photobleached spot obtained by dividing the initial intensity of the spot (average over the first three time points) with the photobleaching step size (n = 30). Multipeak Gaussian fitting of the data, as above, suggests that there are 5.9 ± 1.1 Spc24-GFP molecules per kinetochore (blue curve, n = 30, R2 = 0.87). (E) Histogram depicting the number of kinetochores in the main kinetochore cluster obtained by dividing the initial intensities of kinetochore clusters by the initial intensity of photobleached spots. Gaussian fit to the data yielded a ratio of 13.9 ± 2.7 verifying that the photobleached spots were either single lagging kinetochores or two kinetochores clustered close together (blue curve, n = 27, R2 = 0.77).
Figure 4
Figure 4. Dependence of CENP-A Recruited at Point and Regional Centromere on Intracellular CENP-A Concentration
(A) Relative levels of mCherry-Cse4 and Cse4-GFP recruited in anaphase centromere clusters in a strain expressing chromosomal Cse4-GFP and ectopic mCherry-Cse4 (top panel). Linear regression of the data (n = 79, binned based on the GFP signal) shows inverse correlation between the amount of the two Cse4 species (gray line, R2 = 0.96; data represent mean ± SD). The regression also predicts the signals measured in strains expressing only Cse4-GFP (green square) or Cse4-mCherry (red square, 95% confidence intervals represented by gray curves). (B) Dependence of Cnp1-GFP recruited at the centromere in G2/M cells on its intracellular concentration. Relative intracellular protein concentration was quantified using western blot analysis (top inset) and normalized relative to the lowest expressing strain. Synchronized culture was not used, because the majority of fission cells in an asynchronous culture are in G2/M due to the long duration of this cell-cycle phase. The centromeric Cnp1-GFP in G2/M cells was quantified using previously described methods from the strains (representative images show clusters of six centromeres in G2/M cells) and normalized to the strain with the lowest centromeric signal (strain key: a: YWY277, b: AJY687, c: AJY686, d: AJY688, e: JW3523). Gray curve displays fit to the data with a single exponential rising to the maximum value (n = 4 for western blots, n > 30 for fluorescence measurements, error bars represent SD. R2 = 0.93).

References

    1. Cho U-S, Harrison SC. Recognition of the centromere-specific histone Cse4 by the chaperone Scm3. Proc. Natl. Acad. Sci. USA. 2011;108:9367–9371. - PMC - PubMed
    1. Furuyama T, Henikoff S. Centromeric nucleosomes induce positive DNA supercoils. Cell. 2009;138:104–113. - PMC - PubMed
    1. Xiao H, Mizuguchi G, Wisniewski J, Huang Y, Wei D, Wu C. Nonhistone Scm3 binds to AT-rich DNA to organize atypical centromeric nucleosome of budding yeast. Mol. Cell. 2011;43:369–380. - PMC - PubMed
    1. Black BE, Foltz DR, Chakravarthy S, Luger K, Woods VL, Jr, Cleveland DW. Structural determinants for generating centromeric chromatin. Nature. 2004;430:578–582. - PubMed
    1. Shivaraju M, Unruh JR, Slaughter BD, Mattingly M, Berman J, Gerton JL. Cell-cycle-coupled structural oscillation of centromeric nucleosomes in yeast. Cell. 2012;150:304–316. - PMC - PubMed

Publication types

MeSH terms