. 2013 Aug:61:320-32.
doi: 10.1016/j.freeradbiomed.2013.04.015. Epub 2013 Apr 24.

Glutathione reductase is essential for host defense against bacterial infection

Affiliations

Glutathione reductase is essential for host defense against bacterial infection

Jing Yan et al. Free Radic Biol Med. 2013 Aug.

Abstract

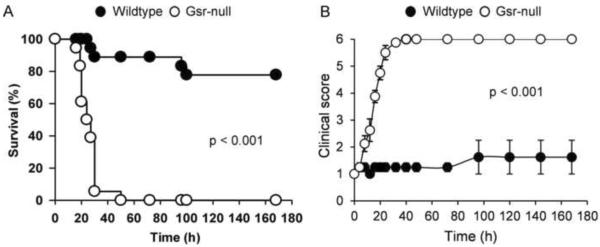
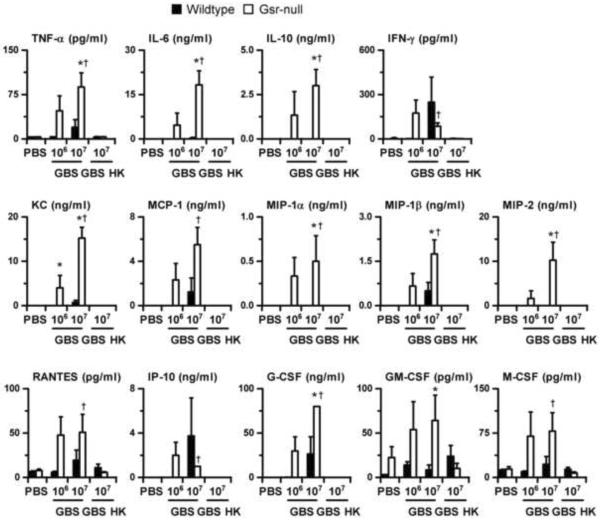
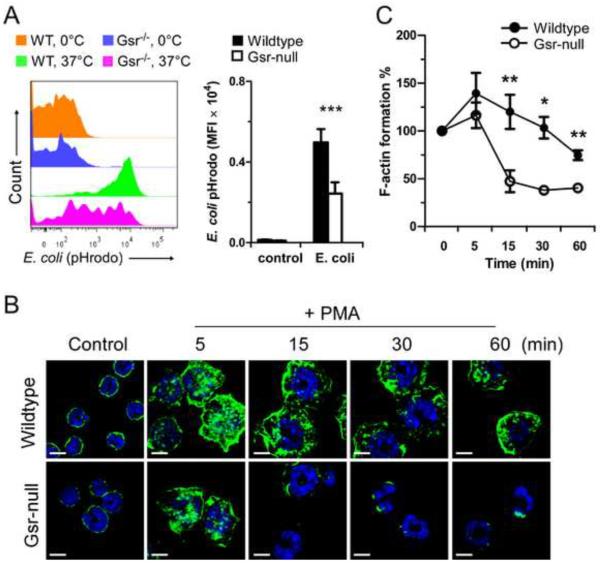
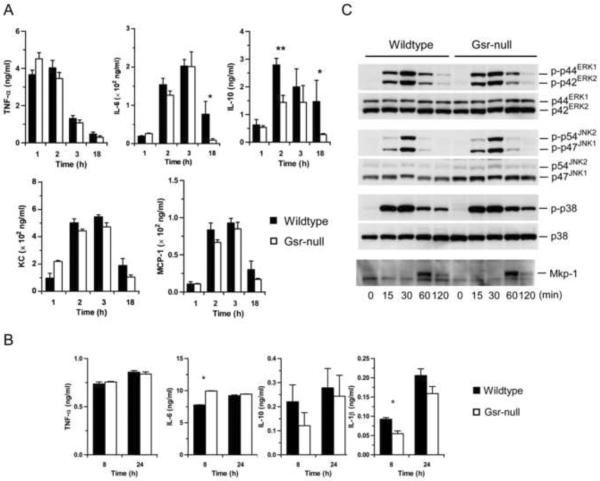
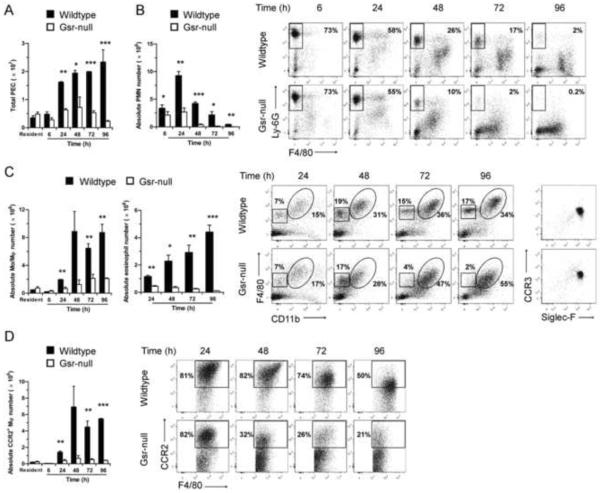
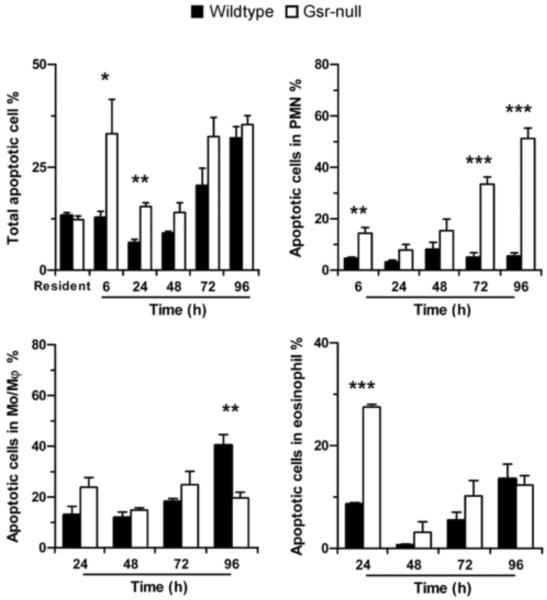
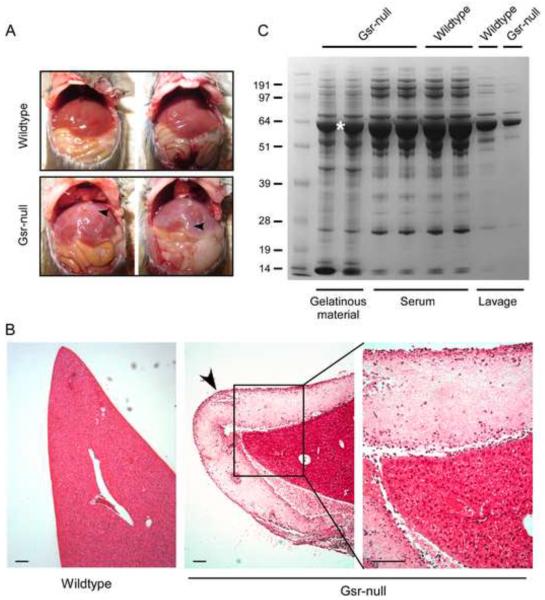
Glutathione reductase (Gsr) catalyzes the reduction of glutathione disulfide to glutathione, a major cellular antioxidant. We have recently shown that Gsr is essential for host defense against the gram-negative bacteria Escherichia coli in a mouse model of sepsis. Although we have demonstrated that Gsr is required for sustaining the oxidative burst and the development of neutrophil extracellular traps, the role of Gsr in other phagocytic functions remains unclear. It is also unclear whether Gsr-deficient mice exhibit host defense defects against gram-positive bacteria. In this study, we characterized the effects of Gsr deficiency on the innate immune responses to a gram-positive bacterium, group B Streptococcus, and to the gram-negative bacterial cell wall component lipopolysaccharide (LPS). We found that, like E. coli, group B Streptococcus resulted in a substantially more robust cytokine response and a markedly higher morbidity and mortality in Gsr-deficient mice than in wild-type mice. The increased morbidity and mortality were associated with greater bacterial burden in the Gsr-deficient mice. Interestingly, Gsr-deficient mice did not exhibit a greater sensitivity to LPS than did wild-type mice. Analysis of the neutrophils of Gsr-deficient mice revealed impaired phagocytosis. In response to thioglycollate stimulation, Gsr-deficient mice mobilized far fewer phagocytes, including neutrophils, macrophages, and eosinophils, into their peritoneal cavities than did wild-type mice. The defective phagocyte mobilization is associated with profound oxidation and aggregation of ascitic proteins, particularly albumin. Our results indicate that the oxidative defense mechanism mediated by Gsr is required for an effective innate immune response against bacteria, probably by preventing phagocyte dysfunction due to oxidative damage.

Keywords: Animal model; Bacterial infection; Free radicals; Group B Streptococcus; Host defense; Oxidative burst; Phagocytes; Redox regulation.


Figures

Figure 1
Figure 1
Morbidity and mortality of wildtype and Gsr-deficient mice following group B streptococcal challenge. A. Survival curves for wildtype and Gsr-deficient mice after GBS challenge. GBS (107 cfu) were introduced i.p. into wildtype and Gsr-deficient mice (n=18 for each group). Mortality was documented over 7 days. Differences between the two groups were determined by Kaplan-Meier analysis. B. Disease severity in wildtype and Gsr-deficient mice after GBS infection. GBS (107 cfu) were introduced i.p. into wildtype and Gsr-deficient mice (n=8 for each group, 4 male and 4 female). Morbidity was evaluated using the scoring system described in Table 1. Data in the graphs represent mean ± SEM of 8 animals. Differences between the two groups were identified using two-way ANOVA.
Figure 2
Figure 2
Serum cytokine and chemokine levels in wildtype and Gsr-deficient mice after GBS challenge. Wildtype and Gsr-deficient mice were infected i.p. with GBS (either 106 or 107 cfu per animal), or given heat-killed GBS (107 cfu equivalent, marked as GBS HK in the graph), or given PBS. Animals were euthanized 24 h after bacterial challenge, and blood was harvested by cardiac puncture. The concentrations of cytokines and chemokines were determined using cytokine multiplex kits. Data in the graphs represent mean ± SEM, n = 4–6. *, p < 0.05, compared to similarly treated wildtype mice. †, p < 0.05, compared to mice given heat-killed GBS (Student's t-test).
Figure 3
Figure 3
Compromised phagocytosis and actin polymerization in Gsr-deficient phagocytes. A. Compromised phagocytosis in Gsr-deficient monocytes. Heparinized whole blood from uninfected wildtype or Gsr-deficient mice was incubated with pHrodo-conjugated E. coli Bioparticles (200 μg/ml) at 0°C (on ice) or at 37 °C for 1 h, and then stained with leukocyte surface proteins. The cells were then analyzed by flow cytometry and the leukocytes were gated to assess engulfment of pHrodo-conjugated E. coli Bioparticles by monocytes (CD11b+Gr-1lowF4/80+). Left panel: Representative histogram of phagocytosis by blood monocytes. Right panel: Graphic depiction of phagocytosis by monocytes. Data represent the mean fluorescence intensity (MFI) of pHrodo™ particles engulfed by blood monocytes (CD11b+Gr-1lowF4/80+). B. Representative images of F-actin in control and PMA-stimulated neutrophils. Neutrophils were isolated from bone marrow and seeded on uncoated glass coverslips. After 1 h, neutrophils were stimulated with PMA (100 nM) for the indicated time, or left untreated (control). F-actin (green) was stained with Alexa Fluor 488-conjugated phalloidin and DNA (blue) was stained with DAPI. Cells were examined by confocal microscopy. Scale bar represents 5 μm. C. Flow cytometry-based quantification of F-actin assembly (measured as MFI) in PMA-stimulated wildtype and Gsr-deficient neutrophils. Bone marrow neutrophils were stimulated with PMA (100 nM) for different periods of time, stained with Alexa Fluor 488-conjugated phalloidin, and analyzed by flow cytometry. For normalization, MFI of untreated neutrophils were set as 100%. Values in the graphs in the right panel of A and C represent mean ± SEM from at least 3 independent experiments. *, p < 0.05; **, p < 0.01 (Student's t-test), compared between the wildtype and Gsr-deficient groups.
Figure 4
Figure 4
LPS responses of Gsr-deficient mice and macrophages. A. Serum cytokine and chemokine levels in wildtype and Gsr-deficient mice. Mice were challenged with LPS i.p. (15 mg/g body weight) and euthanized at the indicated time-points. Blood was collected by cardiac puncture, and serum cytokines were measured by ELISA. Values in the graphs represent mean ± SEM of 5–10 independent experiments. B. Cytokines produced by thioglycollate-elicited peritoneal macrophages. Macrophages were stimulated with LPS (100 ng/ml) for 8 or 24 h, and cytokines in the medium were assessed by ELISA. *, p < 0.05 (Student's t-test), compared between the wildtype and Gsr-deficient groups. Values in the graphs represent mean ± SEM of at least 3 independent experiments. C. The activation of MAPKs and Mkp-1 induction in LPS-stimulated peritoneal macrophages. Macrophages were harvested from thioglycollate-stimulated mice, and stimulated with LPS (100 ng/ml). The activation of MAPKs and the induction of Mkp-1 were assessed by Western blot analysis using antibodies against phospho-MAPKs and Mkp-1. The blots were stripped and blotted with antibodies against total MAPKs. Data shown are representative results.
Figure 5
Figure 5
Abnormal leukocyte mobilization in Gsr-deficient mice after thioglycollate stimulation. Resident and thioglycollate-elicited peritoneal cells were harvested from the peritoneal cavity of wildtype and Gsr-deficient mice either prior to or after thioglycollate stimulation at various time-points. Numbers of total leukocytes in peritoneal lavage fluid were counted using a hemocytometer. The peritoneal lavage cells were sedimented by centrifugation, stained with leukocyte markers, and analyzed by flow cytometry. Peritoneal lavage cells were first gated on forward scatter (FSC) and side scatter (SSC) to exclude cell debris, and viable cells were then gated for CD11b+Ly-6GhighF4/80 neutrophils, and CD11b+F4/80high monocytes/macrophages. The CD11bF4/80low cells outlined in the squares of were further gated for CCR3 and Siglec-F expression (right column). Since the CD11bF4/80low cells were positive for Siglec-F and CCR3, these cells are considered to be eosinophils. A. Time-dependent changes in the numbers of total peritoneal elicited leukocyte cells (PEC). B. Time-dependent changes in the numbers (bar graph on the left) and flow cytometry plots (on the right) of peritoneal neutrophils. Dots in the rectangle regions within the scatter plots are neutrophils (CD11b+Ly-6GhighF4/80), and numbers given on the right side of the rectangles indicate the percentage of neutrophils among the total PEC. C. Time-dependent changes in the numbers (bar graph on the left) and flow cytometry plots (on the right) of peritoneal monocytes/macrophages and eosinophils. Dots in the ovals and squares within the scatter plots are macrophages/monocytes (CD11b+F4/80high) and eosinophils (CD11bF4/80lowSiglec-F+CCR3+), respectively. The percentages of the monocytes/macrophages (on the right side of the ovals) and the eosinophils (above the squares) among the total PEC are indicated in the plots. Cells in the squares were further gated and plotted for CCR3 and Siglec-F expression (right columns). Since the CD11bF4/80low cells were positive for Siglec-F and CCR3, these cells are considered as eosinophils. D. Time-dependent changes in the numbers (bar graph on the left) and flow cytometry plots (on the right) of inflammatory monocytes/macrophages. The CD11b+F4/80high monocytes/macrophages outlined in the ovals of cytometry plots in panel B were further gated for CCR2 expression to identify inflammatory monocytes/macrophages (CD11b+F4/80highCCR2+). The numbers given in the scatter plots in D indicate the percentage of inflammatory monocytes/macrophages within the monocyte/macrophage population. Absolute numbers of each leukocyte subset were calculated according to the total PEC numbers and the percentages of each leukocyte groups determined by flow cytometry. Values in the graphs represent mean ± SEM of at least 3 independent experiments. *, p < 0.05; **, p < 0.01; ***, p < 0.001 (Student's t-test), compared between wildtype and Gsr-deficient groups at the same time-points. The scatter plots shown are results from representative experiments.
Figure 6
Figure 6
Increased phagocyte apoptosis in the peritoneal cavity of Gsr-deficient mice after thioglycollate stimulation. Mice were treated as described for Figure 5, and peritoneal leukocytes were harvested by lavage. The percentages of apoptotic cells in total PEC and in distinct leukocyte populations were quantified by flow cytometry after staining with annexin V and PI. Cells that were positive for annexin V were counted as apoptotic cells. Data represent mean ± SEM from at least 3 independent experiments. *, p < 0.05; **, p < 0.01; ***, p < 0.001 (Student's t-test), compared between the two different groups at the same time-points.
Figure 7
Figure 7
Demonstration and characterization of protein aggregation coating the internal organs of Gsr-deficient mice after thioglycollate stimulation. Female wildtype and Gsr-deficient mice were stimulated with thioglycollate medium (3%, 2 ml, i.p.) and euthanized 48 h later. The peritoneal cavities were opened for photography, or collection of the coating on the livers. Livers were excised from the animals, fixed, and liver sections were stained with H&E. A. Photographs of the internal organs of wildtype and Gsr-deficient mice. Note the whitish gelatinous coating materials on the liver of Gsr-deficient mice (indicated by arrows). B. H&E staining of the liver sections. Note the layer of fibrous coating on the surface of the liver of the Gsr-deficient mice marked by an arrow. Scale bar represents 100 μm. C. Coomassie blue staining of proteins in the gelatinous material, serum, and lavage samples. Mice were euthanized to collect blood by cardiac puncture, or peritoneal fluids by lavage with PBS. Additional mice were euthanized to collect the gelatinous coating materials on the liver of Gsr-deficient mice. The lavage fluids were centrifuged and supernatants were separated on NuPAGE gel together with serum and the gelatinous coating collected from the surface of the livers of thioglycollate-stimulated Gsr-deficient mice. The band marked with an asterisk was subjected to mass spectrometry analysis.

Similar articles

Cited by

References

    1. Reed PW. Glutathione and the hexose monophosphate shunt in phagocytizing and hydrogen peroxide-treated rat leukocytes. J. Biol. Chem. 1969;244:2459–2464. - PubMed
    1. Strauss RR, Paul BB, Jacobs AA, Sbarra AJ. The role of the phagocyte in host-parasite interactions. XIX. Leukocytic glutathione reductase and its involvement in phagocytosis. Arch. Biochem. Biophys. 1969;135:265–271. - PubMed
    1. Loos H, Roos D, Weening R, Houwerzijl J. Familial deficiency of glutathione reductase in human blood cells. Blood. 1976;48:53–62. - PubMed
    1. Roos D, Weening RS, Voetman AA, van Schaik ML, Bot AA, Meerhof LJ, Loos JA. Protection of phagocytic leukocytes by endogenous glutathione: studies in a family with glutathione reductase deficiency. Blood. 1979;53:851–866. - PubMed
    1. Yan J, Meng X, Wancket LM, Lintner K, Nelin LD, Chen B, Francis KP, Smith CV, Rogers LK, Liu Y. Glutathione reductase facilitates host defense by sustaining phagocytic oxidative burst and promoting the development of neutrophil extracellular traps. J. Immunol. 2012;188:2316–2327. - PMC - PubMed

Publication types

LinkOut - more resources