

A rapid Q-PCR titration protocol for adenovirus and helper-dependent adenovirus vectors that produces biologically relevant results
- PMID: 23624118
- PMCID: PMC3679352
- DOI: 10.1016/j.jviromet.2013.04.013
A rapid Q-PCR titration protocol for adenovirus and helper-dependent adenovirus vectors that produces biologically relevant results
Abstract
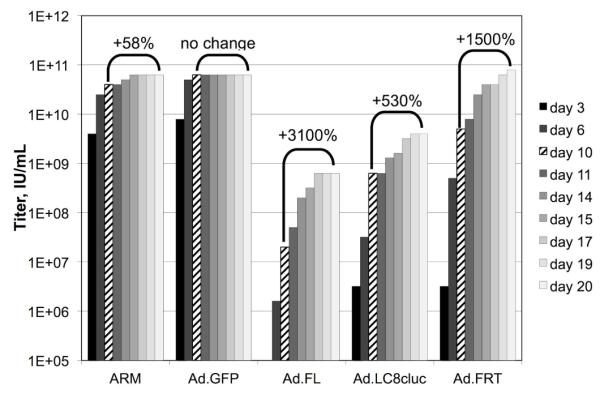
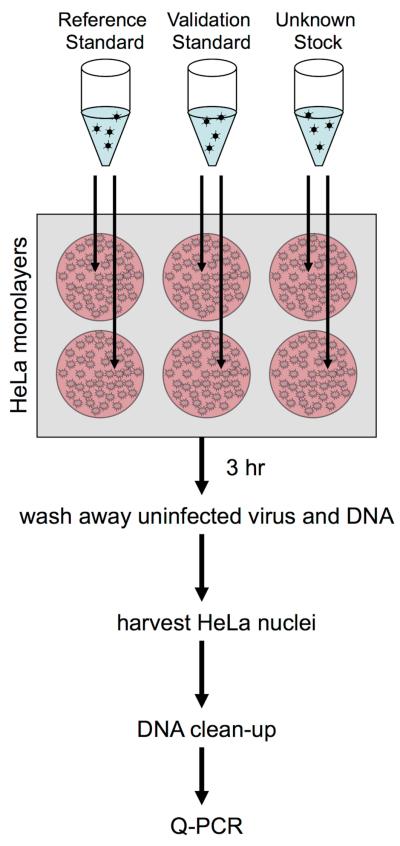
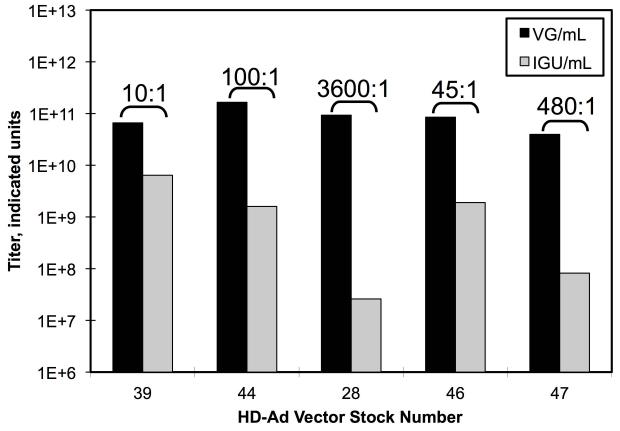
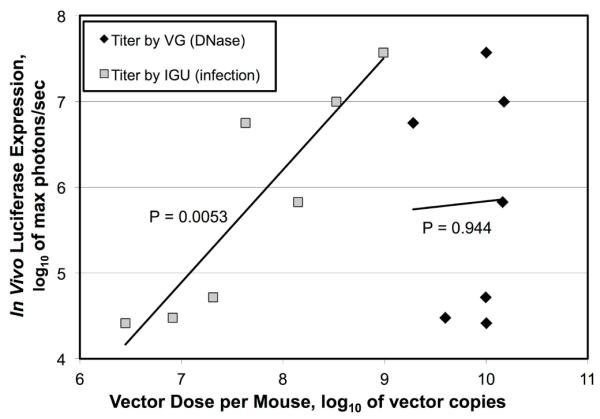
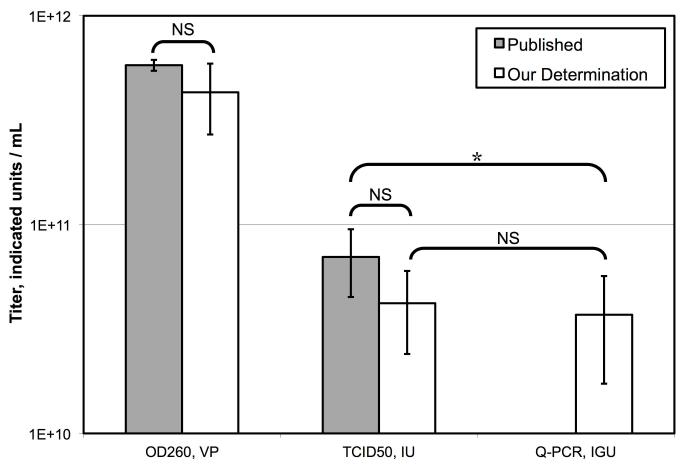
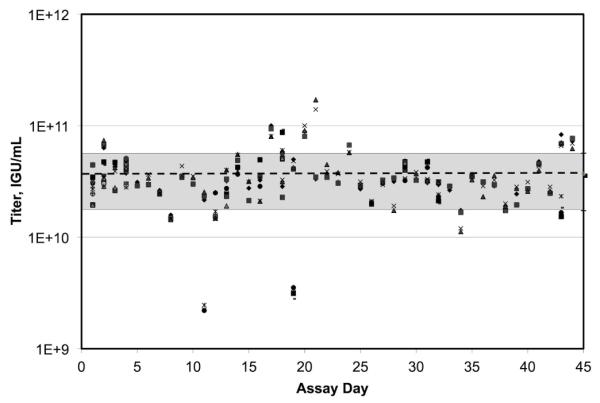
Adenoviruses are employed in the study of cellular processes and as expression vectors used in gene therapy. The success and reproducibility of these studies is dependent in part on having accurate and meaningful titers of replication competent and helper-dependent adenovirus stocks, which is problematic due to the use of varied and divergent titration protocols. Physical titration methods, which quantify the total number of viral particles, are used by many, but are poor at estimating activity. Biological titration methods, such as plaque assays, are more biologically relevant, but are time consuming and not applicable to helper-dependent gene therapy vectors. To address this, a protocol was developed called "infectious genome titration" in which viral DNA is isolated from the nuclei of cells ~3 h post-infection, and then quantified by Q-PCR. This approach ensures that only biologically active virions are counted as part of the titer determination. This approach is rapid, robust, sensitive, reproducible, and applicable to all forms of adenovirus. Unlike other Q-PCR-based methods, titers determined by this protocol are well correlated with biological activity.
Copyright © 2013 Elsevier B.V. All rights reserved.
Figures
Similar articles
-
A real-time PCR method to rapidly titer adenovirus stocks.Methods Mol Med. 2007;130:185-92. doi: 10.1385/1-59745-166-5:185. Methods Mol Med. 2007. PMID: 17401173
-
Production of high-capacity adenovirus vectors.Methods Mol Biol. 2014;1089:211-29. doi: 10.1007/978-1-62703-679-5_15. Methods Mol Biol. 2014. PMID: 24132488
-
Characterization of high-capacity adenovirus production by the quantitative real-time polymerase chain reaction: a comparative study of different titration methods.J Gene Med. 2008 Oct;10(10):1092-101. doi: 10.1002/jgm.1236. J Gene Med. 2008. PMID: 18642400
-
Rapid determination of adenoviral vector titers by quantitative real-time PCR.J Virol Methods. 2001 Apr;93(1-2):181-8. doi: 10.1016/s0166-0934(01)00257-9. J Virol Methods. 2001. PMID: 11311357
-
Chromatographic purification of recombinant adenoviral and adeno-associated viral vectors: methods and implications.Gene Ther. 2005 Oct;12 Suppl 1:S5-17. doi: 10.1038/sj.gt.3302611. Gene Ther. 2005. PMID: 16231055 Review.
Cited by
-
NEAT1 Confers Radioresistance to Hepatocellular Carcinoma Cells by Inducing Autophagy through GABARAP.Int J Mol Sci. 2022 Jan 10;23(2):711. doi: 10.3390/ijms23020711. Int J Mol Sci. 2022. PMID: 35054896 Free PMC article.
-
An SDS-NaOH-based method to isolate genome of recombinant adeno-associated virus vectors for physical titer measurement.PLoS One. 2025 Apr 3;20(4):e0315921. doi: 10.1371/journal.pone.0315921. eCollection 2025. PLoS One. 2025. PMID: 40179116 Free PMC article.
-
Integration of Fluorescence Detection and Image-Based Automated Counting Increases Speed, Sensitivity, and Robustness of Plaque Assays.Mol Ther Methods Clin Dev. 2019 Jul 31;14:270-274. doi: 10.1016/j.omtm.2019.07.007. eCollection 2019 Sep 13. Mol Ther Methods Clin Dev. 2019. PMID: 31489337 Free PMC article.
-
Rapid and stain-free quantification of viral plaque via lens-free holography and deep learning.Nat Biomed Eng. 2023 Aug;7(8):1040-1052. doi: 10.1038/s41551-023-01057-7. Epub 2023 Jun 22. Nat Biomed Eng. 2023. PMID: 37349390 Free PMC article.
-
Unabated adenovirus replication following activation of the cGAS/STING-dependent antiviral response in human cells.J Virol. 2014 Dec;88(24):14426-39. doi: 10.1128/JVI.02608-14. Epub 2014 Oct 8. J Virol. 2014. PMID: 25297994 Free PMC article.
References
6. References
-
- Alba R, Hearing P, Bosch A, Chillon M. Differential amplification of adenovirus vectors by flanking the packaging signal with attB/attP-PhiC31 sequences: implications for helper-dependent adenovirus production. Virology. 2007;367:51–8. - PubMed
-
- Berk AJ. Recent lessons in gene expression, cell cycle control, and cell biology from adenovirus. Oncogene. 2005;24:7673–85. - PubMed
-
- Chow LT, Gelinas RE, Broker TR, Roberts RJ. An amazing sequence arrangement at the 5′ ends of adenovirus 2 messenger RNA. Cell. 1977;12:1–8. - PubMed
8. Web References
-
- Journal of Gene Medicine 02/22/2012. http://www.abedia.com/wiley/vectors.php.
Publication types
MeSH terms
Substances
Grants and funding
LinkOut - more resources
Full Text Sources
Other Literature Sources
