. 2013 Aug-Sep:61-62:1-10.
doi: 10.1016/j.micpath.2013.04.008. Epub 2013 Apr 25.

Group B Streptococcus induces a caspase-dependent apoptosis in fetal rat lung interstitium

Affiliations

Group B Streptococcus induces a caspase-dependent apoptosis in fetal rat lung interstitium

David E Kling et al. Microb Pathog. 2013 Aug-Sep.

Abstract

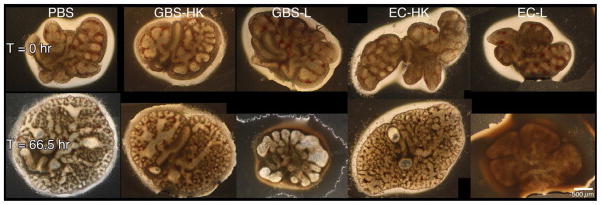
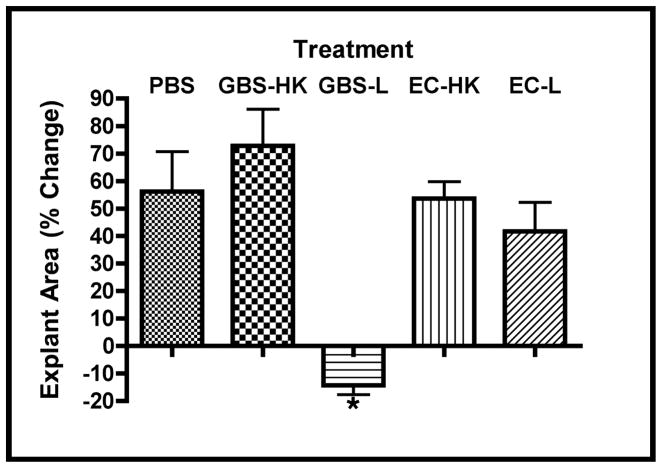
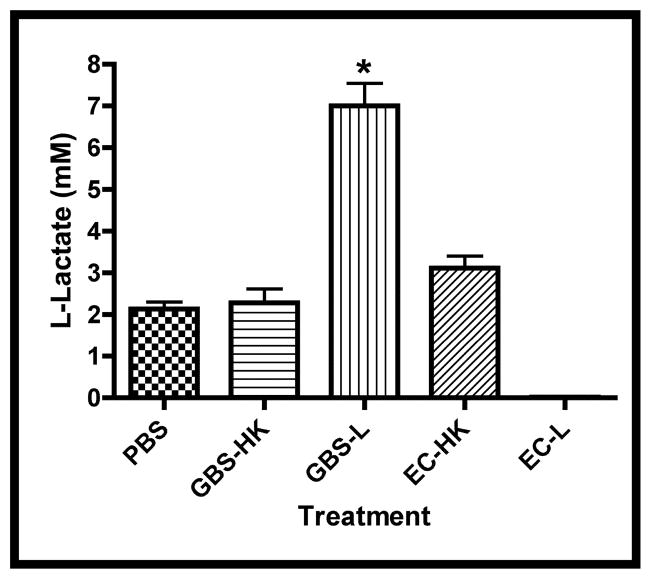
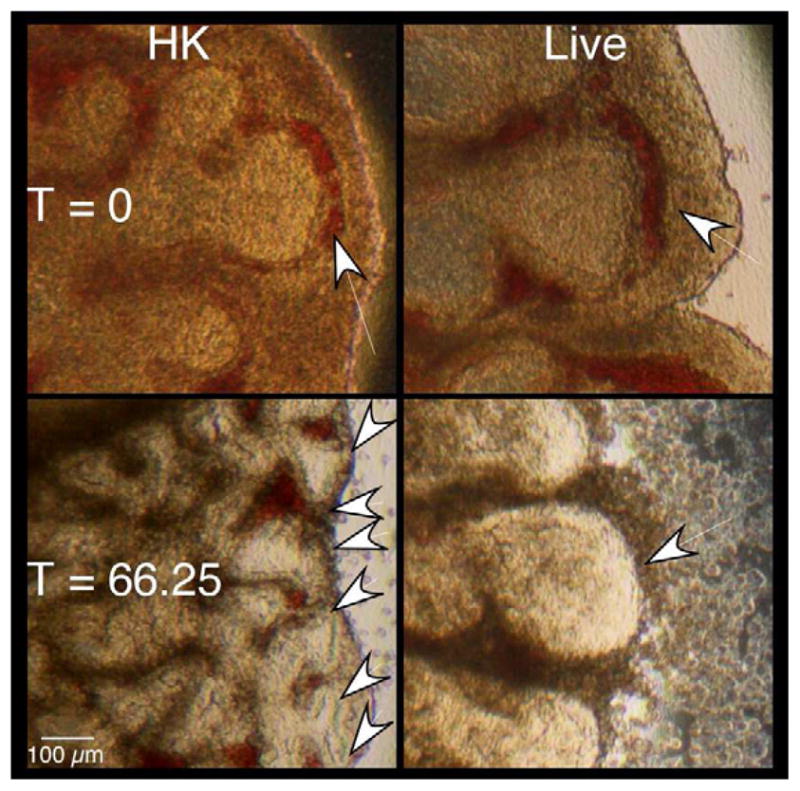
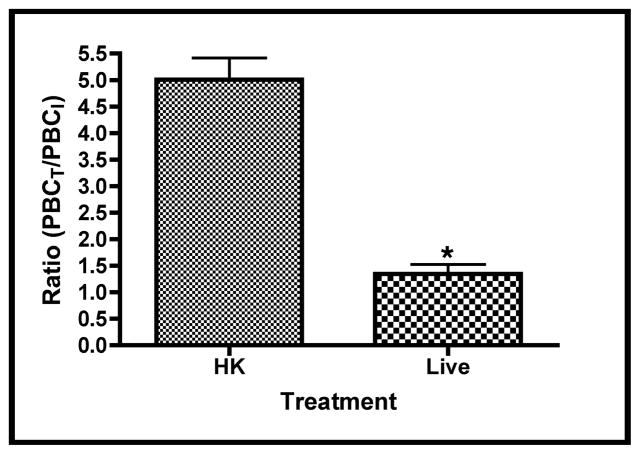
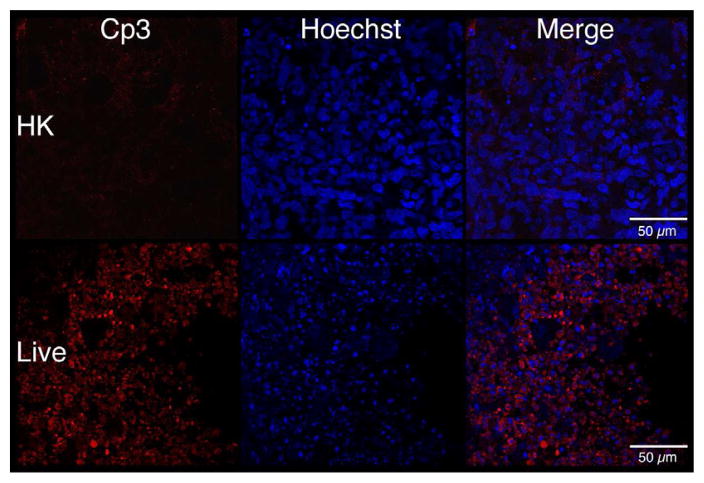
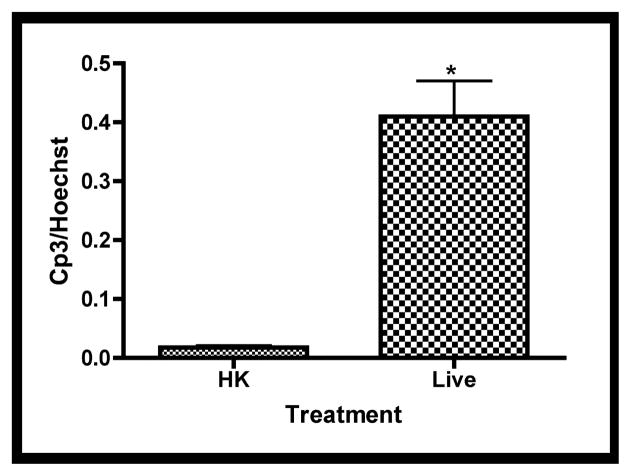
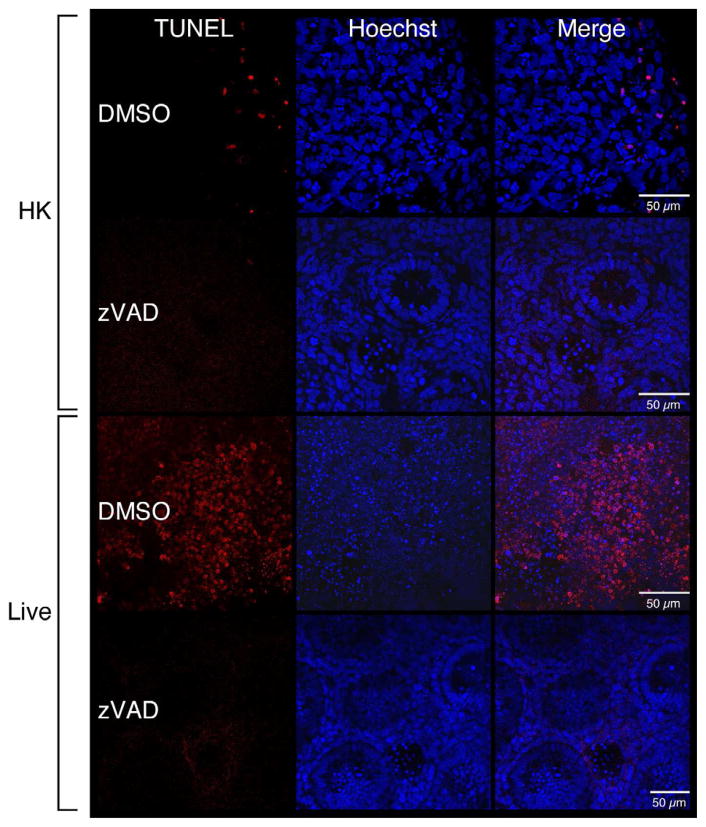
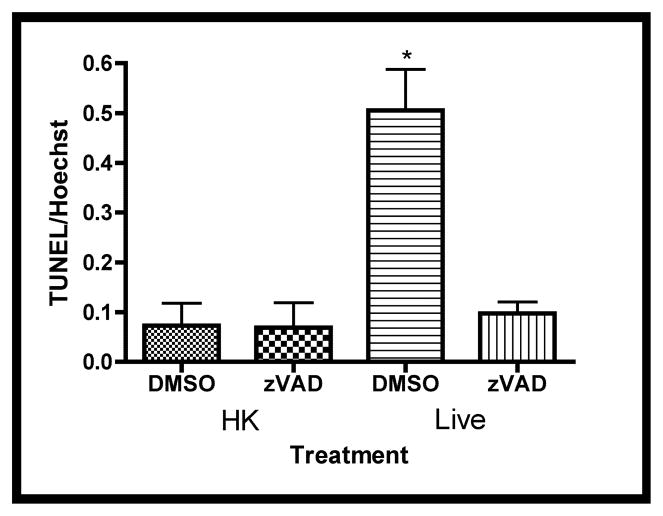
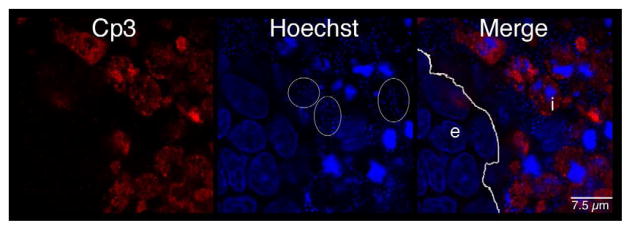
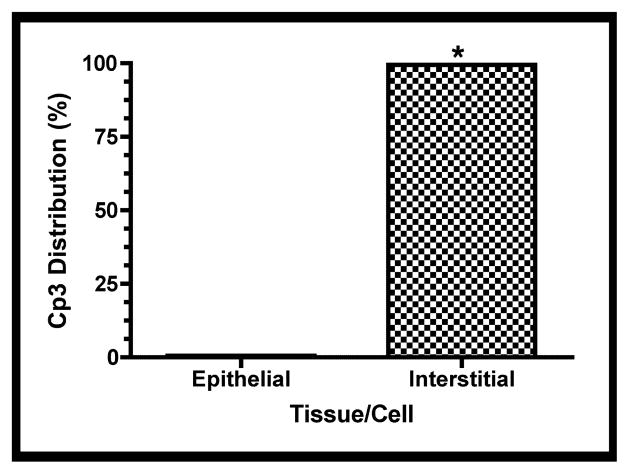
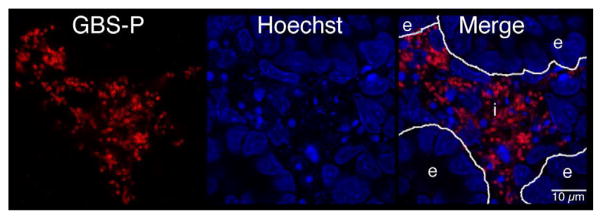
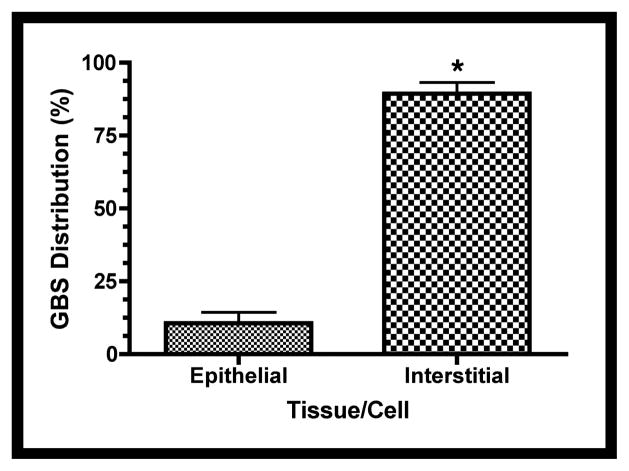
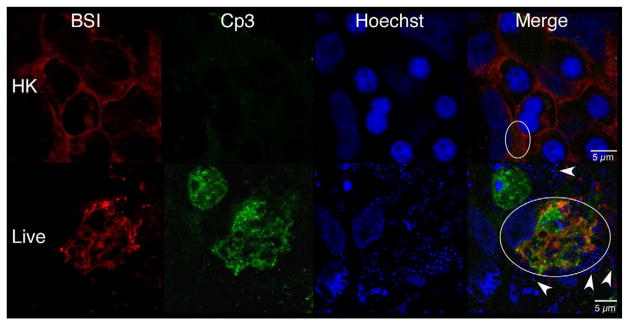
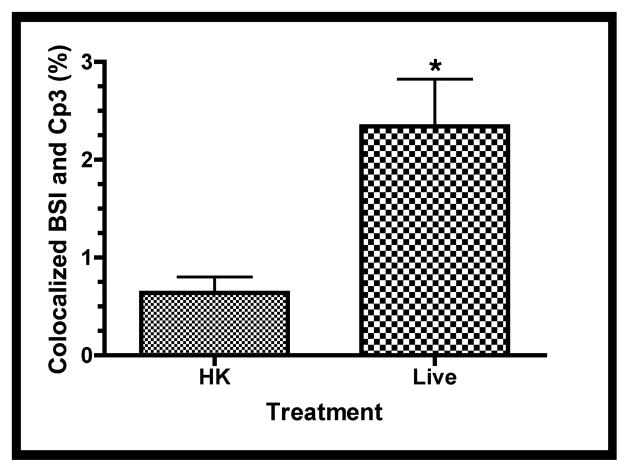
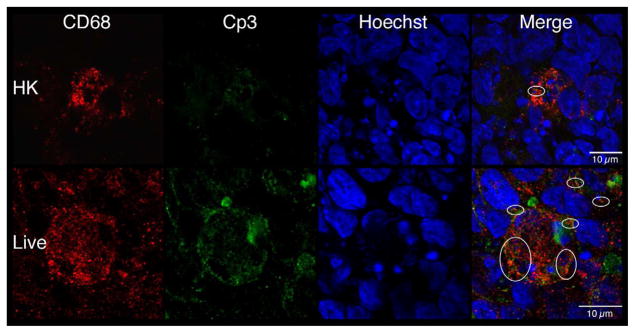
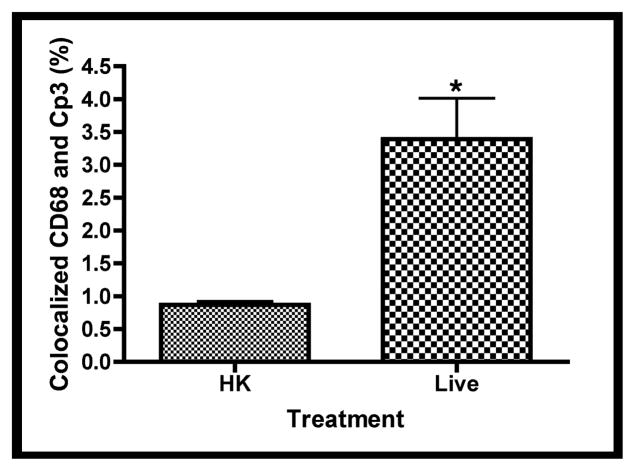
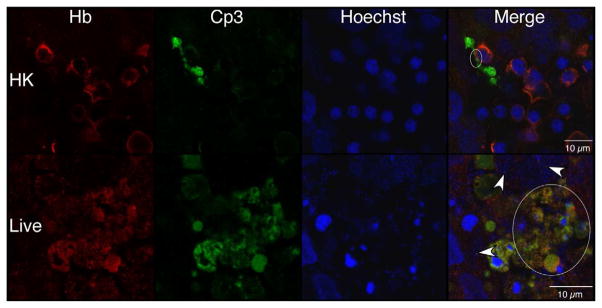
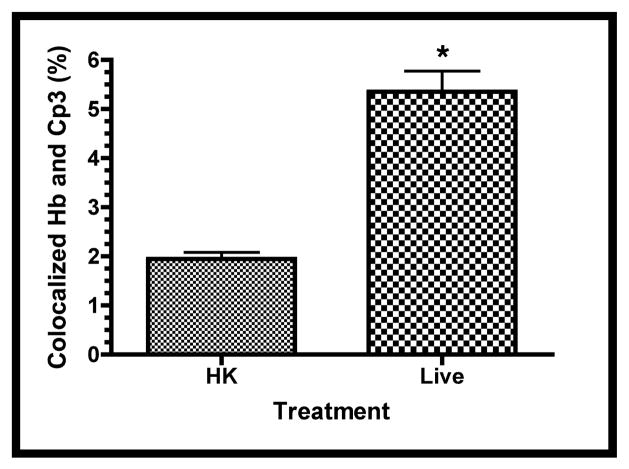
Group B Streptococcus (GBS) is an important pathogen and is associated with sepsis and meningitis in neonates and infants. An ex vivo model that facilitates observations of GBS interactions with multiple host cell types over time was used to study its pathogenicity. GBS infections were associated with profound reductions in fetal lung; explant size, and airway branching. Elevated levels of apoptosis subsequent to GBS infections were observed by whole-mount confocal immunofluorescence using activated-caspase-3-antibodies and terminal deoxynucleotidyl transferase dUTP nick end-labeling (TUNEL) assays. The caspase inhibitor Z-VAD-FMK abolished the increase in TUNEL-positive cells associated with GBS infections, indicating that the GBS-induced apoptosis was caspase-dependent. Digital image analyses revealed that both GBS and the active form of caspase-3 were distributed primarily within the lung interstitium, suggesting that these tissues are important targets for GBS. Antibodies to the active form of caspase-3 colocalized with both macrophage- and erythroblast-markers, suggesting that these hematopoietic cells are vulnerable to GBS-mediated pathogenesis. These studies suggest that GBS infections profoundly alter lung morphology and caspase-dependent hematopoietic cell apoptosis within the lung interstitium play roles in GBS pathophysiology in this model.

Keywords: Ex vivo; Gram-positive; Quantitative colocalization; Respiratory; Sepsis; Streptococcus agalactiae.


Figures

Figure 1
Figure 1. GBS infections alter lung explant tissue growth
Fetal rat lung explants were infected with PBS (negative control), a 1,000-fold excess heat-killed GBS strain A909 (GBS-HK), live GBS strain A909 (GBS-L), and E. coli strain EC1 (EC-HK and EC-L). A. Representative phase contrast images of fetal rat lung explants at initiation and termination of experiment. Composite images were used for tissues exceeded the image field size. B. Explant area percent changes subsequent to GBS infections. Data shows the values from at least six independent experiments in which (1 – 4) explants were used per experiment. Error bars show standard error of the mean (SEM) and asterisk indicates statistical significance for all comparisons with GBS-L (at least P < 0.01).
Figure 2
Figure 2. Infection-associated Media Changes
Media changes including glucose concentration, pH changes (Δ pH), and L-lactate were measured in the spent media at the experimental termination (66.5 hrs.). A. Concentrations of glucose in treatment groups, asterisk indicates statistical significance for both GBS-L and EC-L with respect to the other samples (P < 0.001). B. Difference in spent media pH (Δ pH) between termination and initial values for treatment groups. Asterisk indicates statistical significance for GBS-L with respect to the other samples (P < 0.001). C. Concentrations of L-lactate in spent media subsequent to infections. Data points of all three graphs represent mean values from at least 5 independent experiments and error bars represent SEM.
Figure 3
Figure 3. GBS infections alter fetal lung branching morphogenesis
Branches formed at experimental termination (three days) in explants infected with either heat-killed (HK) or live GBS strain A909. A. Images of sections from representative explants at initiation and termination of experiments. Arrows indicate peripheral lung bud numbers. B. Mean ratios of terminal over initial peripheral bud counts (PBCs). Data collected from four independent experiments of which at least two replicate lung pairs for each treatment group were used. Error bars are SEM and an asterisk indicates statistical significance (P < 0.001).
Figure 4
Figure 4. Tissue distribution of activated caspase-3 subsequent to GBS infections
Fetal lung explants were infected with either heat killed (HK) or live GBS as in previous experiments. A. Representative confocal immunofluorescence images of fixed tissues stained whole-mount with activated caspase-3-specific antibodies (red) and Hoechst 33342 (cell nuclei, blue). B. Quantitation of caspase-3 activity normalized to its associated Hoechst staining. Data shows mean values from three independent experiments in which at least two replicates were used per experiment. Error bars are SEM and asterisk indicates statistical significance (P < 0.003).
Figure 5
Figure 5. Increased DNA-fragmentation subsequent to live GBS infections
Fetal rat lung explants were treated with either HK or live GBS for 66.5 hours as well as DMSO or the caspase-3 Z-VAD-FMK (50 μM, zVAD). Whole-mounted tissues were subjected to terminal deoxynucleotidyl transferase dUTP nick end-labeling (TUNEL) assays (red) and Hoechst 33342-staining (blue). A. Representative images from HK- and live-infected explants. B. Quantitation of TUNEL-positivity as a function of Hoechst staining. Data shows mean values from three independent experiments in which three replicates were used for each treatment of each experiment. Error bars are SEM and asterisk indicates statistical significance (P = 0.001).
Figure 6
Figure 6. Distribution of GBS and activated caspase-3 within fetal rat lung explants
Fetal rat lung explants were infected with GBS as described above. A. Representative whole-mount confocal immunofluorescence image of active caspase-3 (red) in GBS-infected fetal rat lung explants. White line indicates the boundary between epithelium (e) and interstitium (i). B. Quantitative analysis of the distribution of the active form of caspase-3 (Cp3) between the epithelia and interstitium of fetal rat lung explants subsequent to live GBS infections. Data collected from representative images from four independent experiments (P < 0.0001). C. Representative confocal immunofluorescence image of GBS (red) detected with group B antigen-specific antibodies (GBS-P) in fetal rat lung explants. White lines demarcate tissue boundaries between epithelia (e) and interstitium (i). D. Quantitative analysis of the distribution of GBS between epithelia and the interstitium of fetal rat lung explants. Data collected from representative images of four independent experiments (P < 0.0001). Error bars are SEM. Hoechst is the nuclear counterstain (blue), which also detects GBS nucleoids (ovals).
Figure 7
Figure 7. Colocalization of the active form of caspase-3 (Cp3) with hematopoietic cells
Confocal immunofluorescence of fetal rat lung explants infected with either live or heat-killed (HK) GBS for 66.5 hours. A. Representative images showing colocalization of hematopoietic marker BSI-isolectin (red) and activated caspase-3-specific (Cp3) antibodies (green) in both live and HK infected explants. B. Quantitation of BSI and Cp3 colocalization. The Percent Colocalziation is the fraction of colocalized signal from both probes (obtained by color subtraction) divided by the sum of the individual signals multiplied by 100 (see Methods and Figure S3). Data represents mean values pooled from four independent experiments with at least three replicates of each treatment per experiment. Asterisk indicates statistical significance (P = 0.003). Error bars show standard error of the mean (SEM). C. Representative whole-mount confocal images using both CD68- (macrophage, red) and Cp3- (green) antibodies. D. Quantitation of CD68 and Cp3 colocalization. Data represents mean values from three independent experiments with at least two replicate image sets of each treatment per experiment. Asterisk indicates statistical significance (P < 0.02). E. Representative whole-mount confocal images of hemoglobin (Hb) antibodies (red) and Cp3 (green). F. Quantitation of Cp3 and Hb colocalization. Data represents three independent experiments with at least three replicates of each treatment per experiment. Asterisk indicates statistical significance (P < 0.002). Ovals indicate regions of overlap and arrowheads show GBS nucleoids. Hoechst is the nuclear stain (blue).

Similar articles

Cited by

References

    1. Edwards MS, Nizet V. Group B Streptococcal Infections. In: Jack SR, Jerome OK, Christopher BW, Victor N, Yvonne AM, editors. Infectious Diseases of the Fetus and Newborn. 7. Philadelphia: W.B. Saunders: 2011. pp. 419–69.
    1. Baker CJ, Edwards MS. Group B streptococcal conjugate vaccines. Arch Dis Child. 2003;88:375–8. - PMC - PubMed
    1. Desa DJ, Trevenen CL. Intrauterine infections with group B beta-haemolytic streptococci. Br J Obstet Gynaecol. 1984;91:237–9. - PubMed
    1. Verani JR, McGee L, Schrag SJ. Prevention of perinatal group B streptococcal disease--revised guidelines from CDC, 2010. MMWR Recomm Rep. 2010;59:1–36. - PubMed
    1. Heath PT. An update on vaccination against group B streptococcus. Expert review of vaccines. 2011;10:685–94. - PubMed

Publication types