Randomized Controlled Trial
. 2013 Jul:31:205-15.
doi: 10.1016/j.bbi.2013.04.004. Epub 2013 Apr 25.

Transcriptional signatures related to glucose and lipid metabolism predict treatment response to the tumor necrosis factor antagonist infliximab in patients with treatment-resistant depression

Affiliations
Randomized Controlled Trial

Transcriptional signatures related to glucose and lipid metabolism predict treatment response to the tumor necrosis factor antagonist infliximab in patients with treatment-resistant depression

Divya Mehta et al. Brain Behav Immun. 2013 Jul.

Abstract

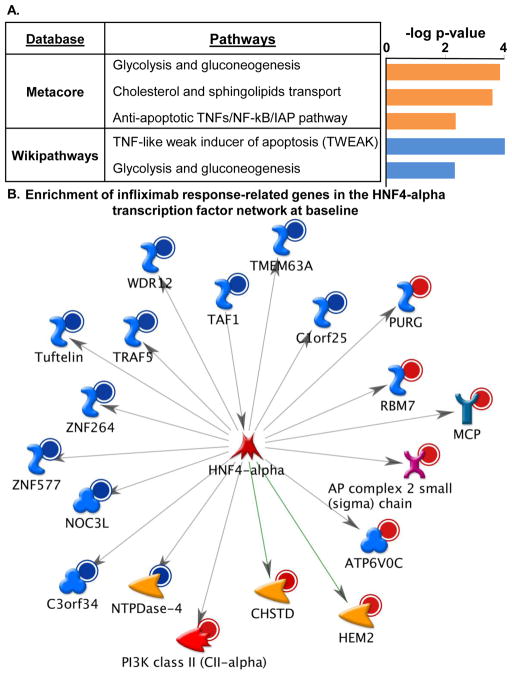
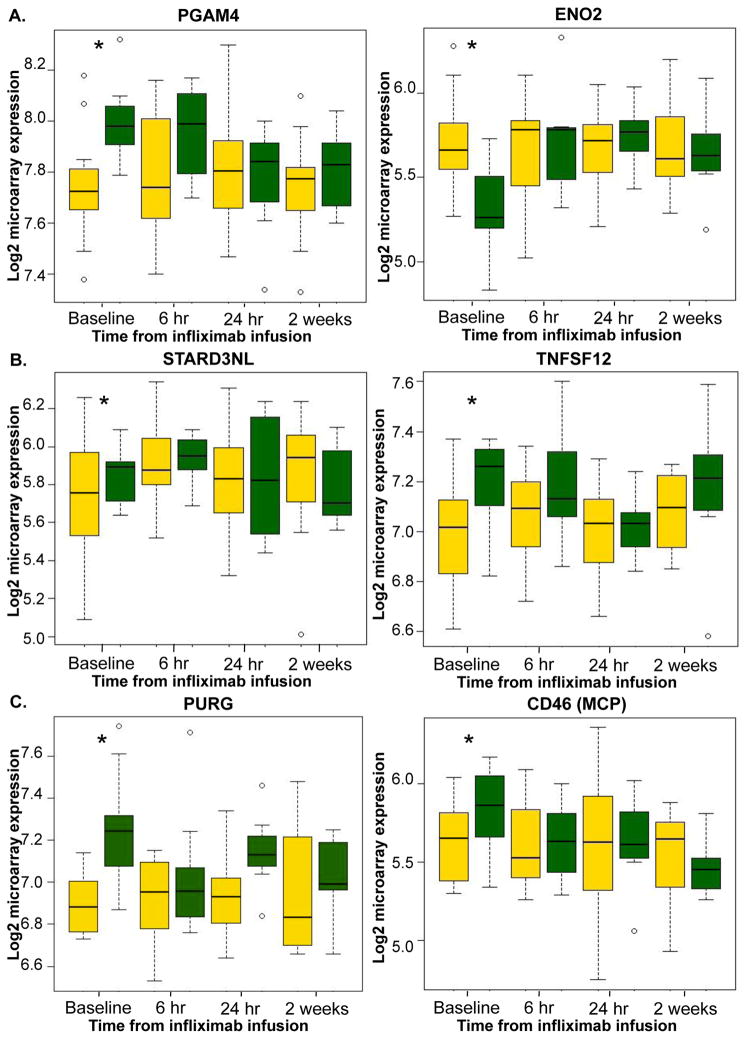
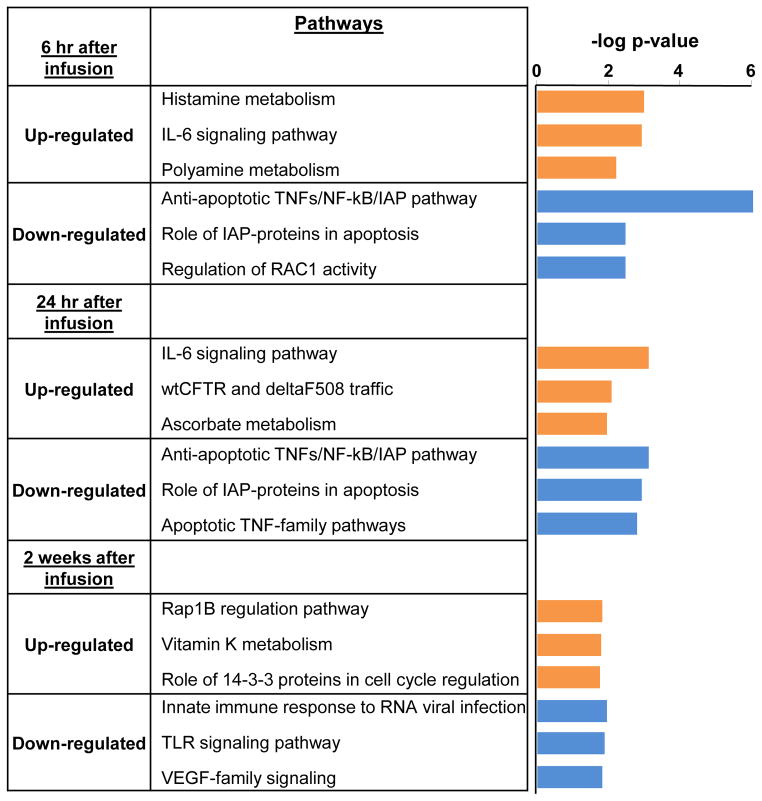
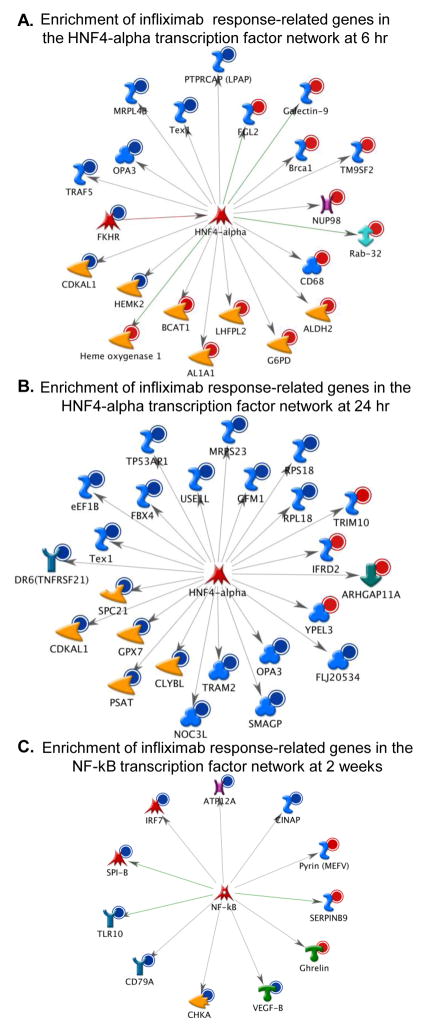
The tumor necrosis factor (TNF) antagonist infliximab was recently found to reduce depressive symptoms in patients with increased baseline inflammation as reflected by a plasma C-reactive protein concentration >5 mg/L. To further explore predictors and targets of response to infliximab, differential gene expression was examined in peripheral blood mononuclear cells from infliximab responders (n=13) versus non-responders (n=14) compared to placebo at baseline and 6 h, 24 h, and 2 weeks after the first infliximab infusion. Treatment response was defined as 50% reduction in depressive symptoms at any point during the 12-week trial. One-hundred-forty-eight gene transcripts were significantly associated (1.2-fold, adjusted p≤0.01) with response to infliximab and were distinct from placebo responders. Transcripts predictive of infliximab response were associated with gluconeogenesis and cholesterol transport, and were enriched in a network regulated by hepatocyte nuclear factor (HNF)4-alpha, a transcription factor involved in gluconeogenesis and cholesterol and lipid homeostasis. Of the 148 transcripts differentially expressed at baseline, 48% were significantly regulated over time in infliximab responders, including genes related to gluconeogenesis and the HNF4-alpha network, indicating that these predictive genes were responsive to infliximab. Responders also demonstrated inhibition of genes related to apoptosis through TNF signaling at 6 h and 24 h after infusion. Transcripts down-regulated in responders 2 weeks after infliximab were related to innate immune signaling and nuclear factor-kappa B. Thus, baseline transcriptional signatures reflective of alterations in glucose and lipid metabolism predicted antidepressant response to infliximab, and infliximab response involved regulation of metabolic genes and inhibition of genes related to innate immune activation.


Figures

Figure 1
Figure 1. Pathways and transcription factor networks significantly represented in differentially regulated gene transcripts at baseline that were predictive of the antidepressant response to infliximab
Infliximab (5mg/kg, n=30) was administered over 12 weeks through an indwelling catheter at baseline, 2 weeks and 6 weeks, and antidepressant response was determined as a 50% reduction in depression severity as measured by the 17-item HAM-D (measured at baseline and 1, 2, 3, 4, 6, 8, 10, and 12 weeks) at any time point during the study. Genes at baseline that were significantly predictive of treatment response (n=148, 1.2 fold change, p 0.01) were involved in pathways related to glycolysis and gluconeogenesis, cholesterol and sphingolipid transport, and apoptosis through tumor necrosis factor (TNF)-related signaling pathway as assessed using Metacore and Wikipathways (A). The most significant transcription factors represented were SP-1 (not shown) and a 19-gene network regulated by hepatocyte nuclear factor (HNF) 4-alpha (B). Red circle= up-regulated genes; Blue circle= down-regulated genes; orange arrowhead= enzyme; red arrowhead= lipid kinase; pink X= transporter; red star= transcription factor; turquoise Y= receptor; blue S =binding protein; blue clover =protein.
Figure 2
Figure 2. Gene transcripts that were predictive of antidepressant response at baseline were altered in responders following the initial infliximab infusion
Infliximab (5mg/kg, n=30) was administered over 12 weeks through an indwelling catheter at baseline, 2 weeks and 6 weeks, and antidepressant response was determined as a 50% reduction in depression severity as measured by the 17-item HAM-D at any time point during the study. Gene expression was assessed at baseline, and 6 hr, 24 hr, and 2 weeks following the first infusion. Transcripts at baseline that were significantly predictive of treatment response and involved in the (A) glycolysis and gluconeogenesis pathway (PGAM4, ENO2), (B) cholesterol and sphingolipid transport pathway (STARD3NL) or apoptosis through tumor necrosis factor (TNF)-related signaling pathway (TNFSF12), and (C) hepatocyte nuclear factor (HNF) 4-alpha transcription factor network (e.g. PURG, CD46/MCP), were differentially regulated over time by infliximab in responders (green boxes) but not in non-responders (yellow boxes) at any point over time (p<0.05). Expression values differed between responders and non-responders only at baseline. *p<0.05 responders compared to non-responders
Figure 3
Figure 3. Genes down-regulated by infliximab over time in responders were related to apoptosis through tumor necrosis factor (TNF) and innate immune activation
Infliximab (5mg/kg, n=30) was administered over 12 weeks through an indwelling catheter at baseline, 2 weeks and 6 weeks, and antidepressant response was determined as a 50% reduction in depression severity as measured by the 17-item HAM-D at any time point during the study. Genes that were up-regulated and down-regulated in responders compared to non-responders were analyzed separately at 6 hr, 24 hr, and 2 weeks to identify significant pathways that were increased or inhibited in response to infliximab that may be related to treatment response. At the earlier time points (6 and 24 hr), responders exhibited increased expression of genes related to IL-6 signaling, and decreased expression of genes related to apoptosis through TNF-related signaling pathways. At 2 weeks, gene expression profiles related to innate immune responses (antiviral and TLR signaling) were decreased in responders with respect to non-responders.
Figure 4
Figure 4. Genes differentially expressed between responders and non-responders were enriched in transcriptional networks of hepatocyte nuclear factor (HNF) 4-alpha and nuclear factor-kappaB (NF-kB), early and late following the initial infliximab infusion, respectively
Infliximab (5mg/kg, n=30) was administered over 12 weeks through an indwelling catheter at baseline, 2 weeks and 6 weeks, and antidepressant response was determined as a 50% reduction in depression severity as measured by the 17-item HAM-D at any time point during the study. Genes that were differentially regulated in responders compared to non-responders were analyzed at 6 hr, 24 hr, and 2 weeks. 6 hr after infliximab, the transcriptional network for HNF4-alpha was composed of mostly of genes up-regulated (red circles, 13/21 genes) in responders compared to non-responders (A), whereas at 24 hr, the transcriptional network for HNF4-alpha was comprised mostly of genes down-regulated in responders (blue circle, 20/24 genes) (B). 2 weeks after the initial infliximab infusion, the genes differentially regulated in responders versus non-responders were enriched in the NF-kB transcriptional network and comprised mostly of down-regulated genes (blue circle, 8/11 genes) (C). Red circle= up-regulated genes; Blue circle= down-regulated genes; orange arrowhead= enzyme; red arrowhead= lipid kinase; pink X= transporter; red star= transcription factor; turquoise Y= receptor; blue S =binding protein; blue clover =protein, green double-headed arrow=RAS superfamily; pink and brown H=channel; green down arrow=regulator; orange arrowhead with hole=protease; green T= receptor ligand.

References

    1. Andringa G, Lam KY, Chegary M, Wang X, Chase TN, Bennett MC. Tissue transglutaminase catalyzes the formation of alpha-synuclein crosslinks in Parkinson’s disease. FASEB journal: official publication of the Federation of American Societies for Experimental Biology. 2004;18(7):932–934. - PubMed
    1. Capuron L, Gumnick JF, Musselman DL, Lawson DH, Reemsnyder A, Nemeroff CB, Miller AH. Neurobehavioral effects of interferon-alpha in cancer patients: phenomenology and paroxetine responsiveness of symptom dimensions. Neuropsychopharmacology. 2002;26(5):643–652. - PubMed
    1. Cattaneo A, Gennarelli M, Uher R, Breen G, Farmer A, Aitchison KJ, Craig IW, Anacker C, Zunsztain PA, McGuffin P, et al. Candidate genes expression profile associated with antidepressants response in the GENDEP study: differentiating between baseline ‘predictors’ and longitudinal ‘targets’. Neuropsychopharmacology. 2013;38(3):377–385. - PMC - PubMed
    1. Cole SW, Galic Z, Zack JA. Controlling false-negative errors in microarray differential expression analysis: a PRIM approach. Bioinformatics. 2003;19(14):1808–1816. - PubMed
    1. Cole SW, Hawkley LC, Arevalo JM, Cacioppo JT. Transcript origin analysis identifies antigen-presenting cells as primary targets of socially regulated gene expression in leukocytes. Proc Natl Acad Sci U S A. 2011;108(7):3080–3085. - PMC - PubMed

Publication types

MeSH terms