. 2013 Aug 15;380(2):299-313.
doi: 10.1016/j.ydbio.2013.04.017. Epub 2013 Apr 24.

Foxg1 is required to limit the formation of ciliary margin tissue and Wnt/β-catenin signalling in the developing nasal retina of the mouse

Affiliations

Foxg1 is required to limit the formation of ciliary margin tissue and Wnt/β-catenin signalling in the developing nasal retina of the mouse

Vassiliki Fotaki et al. Dev Biol. .

Abstract

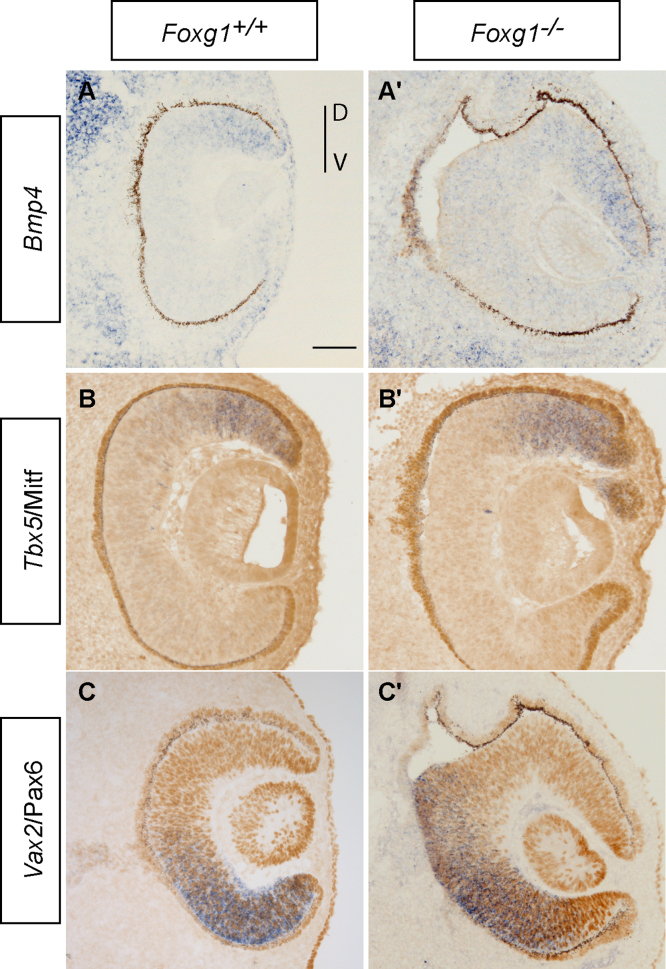
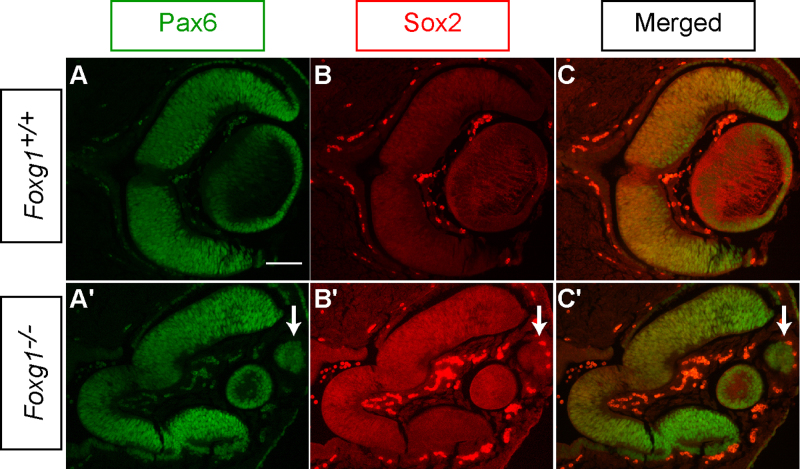
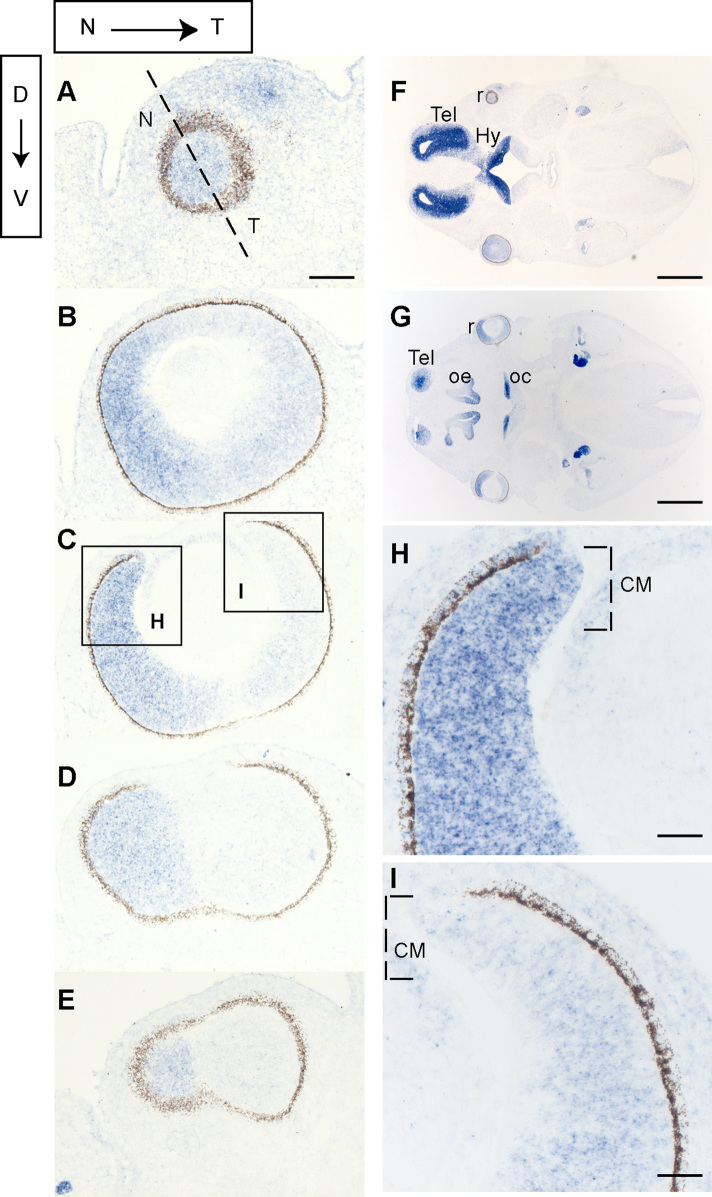
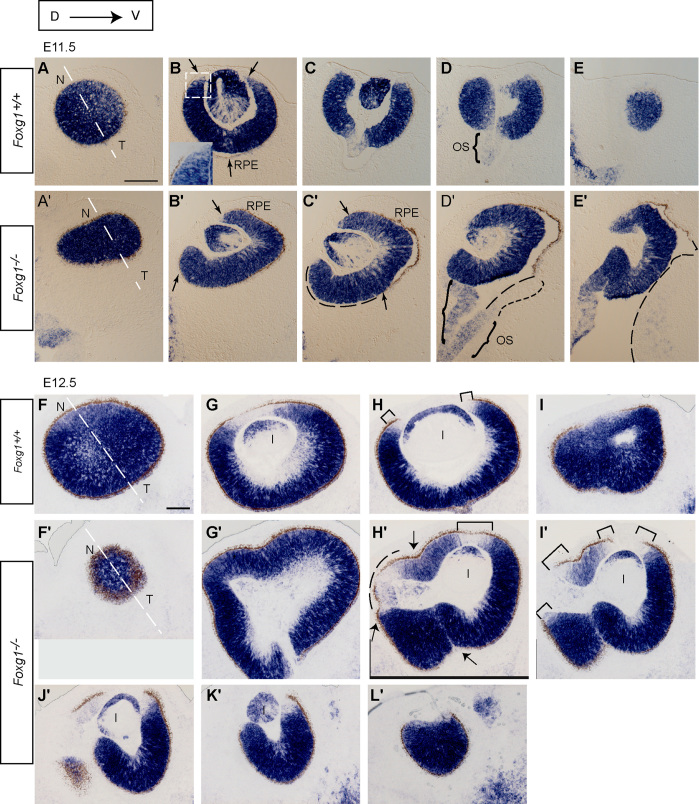
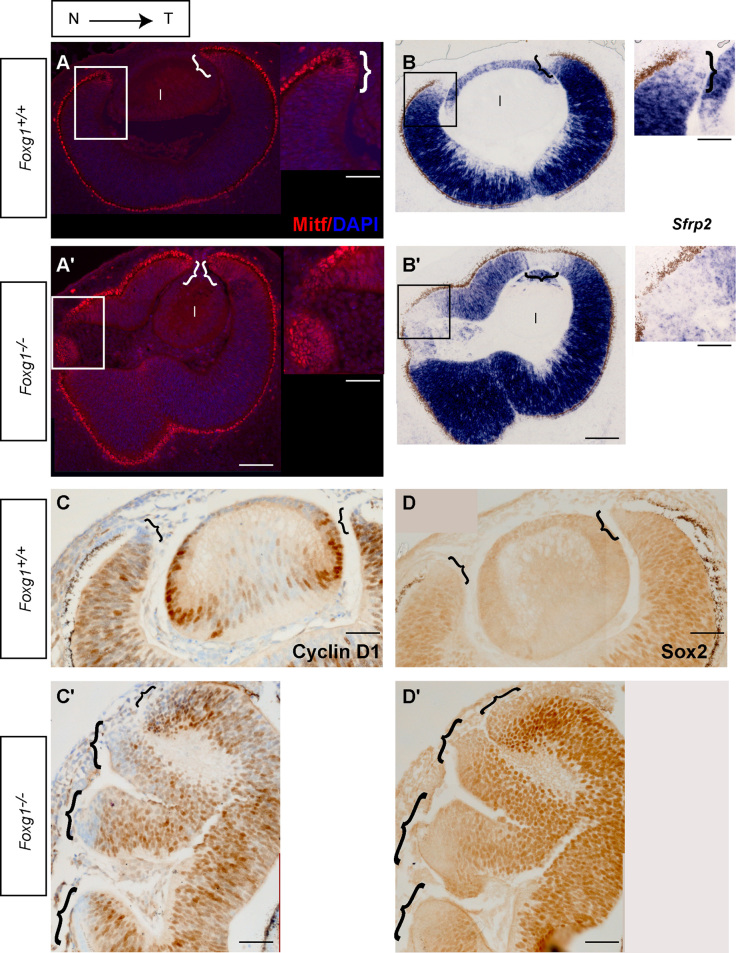
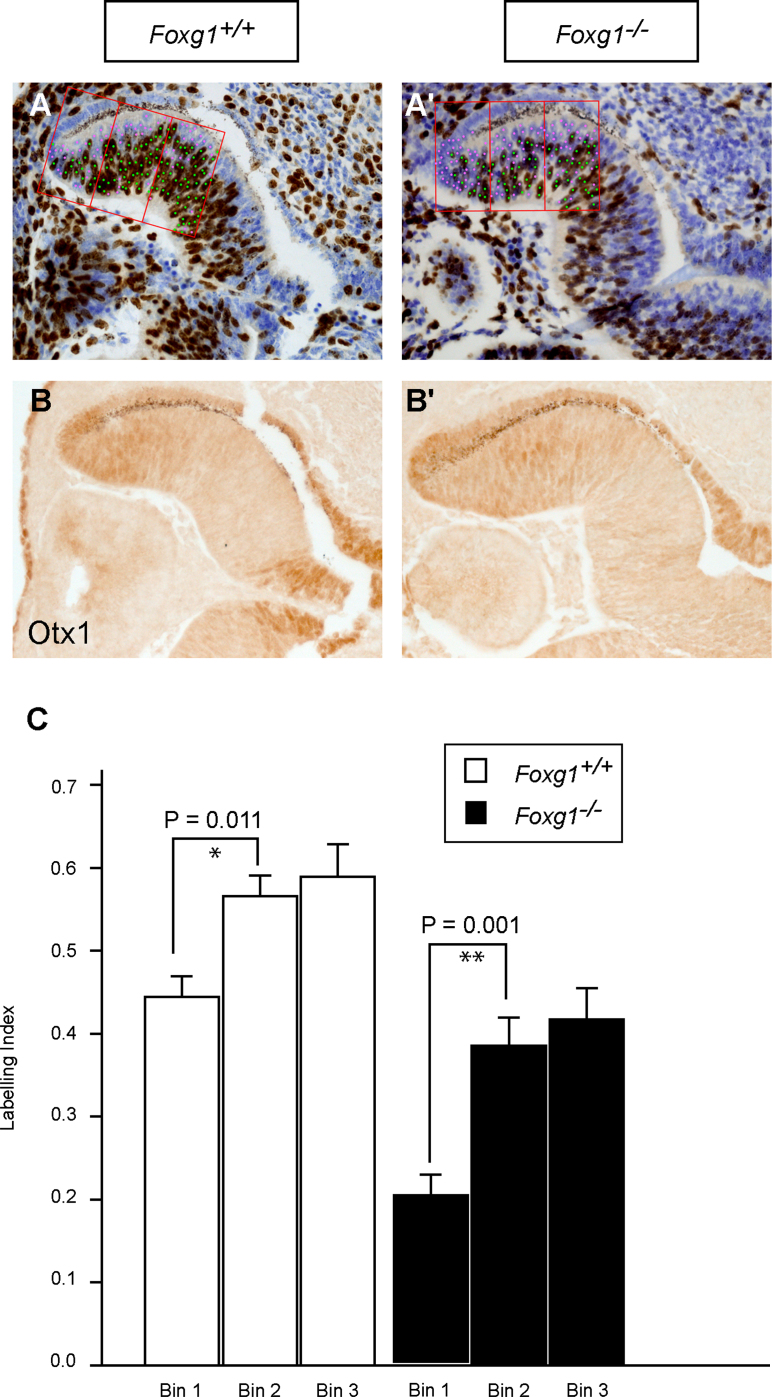
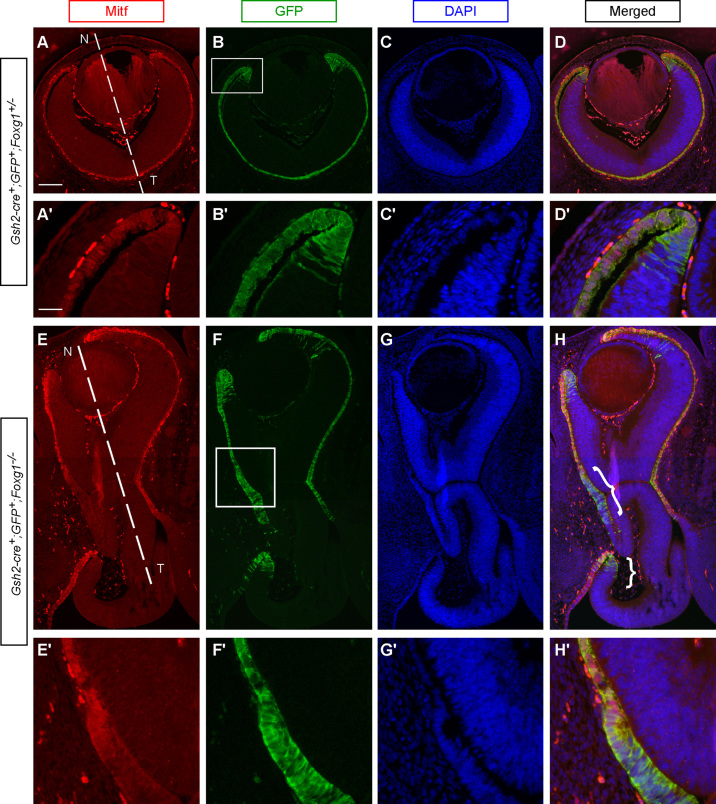
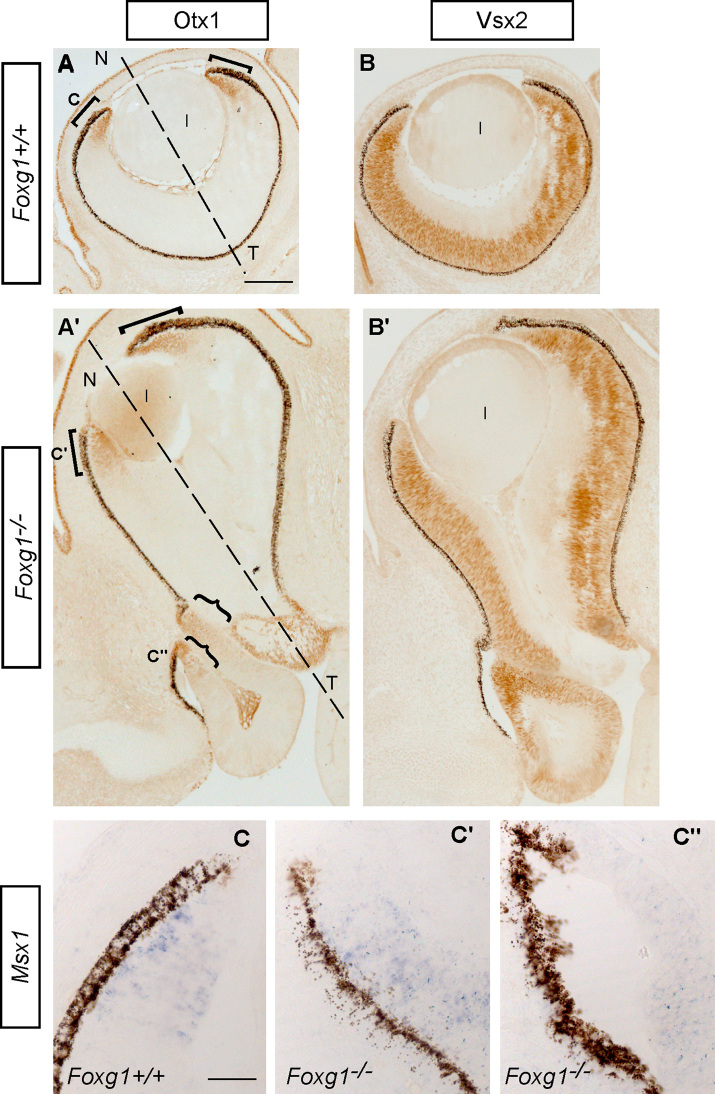
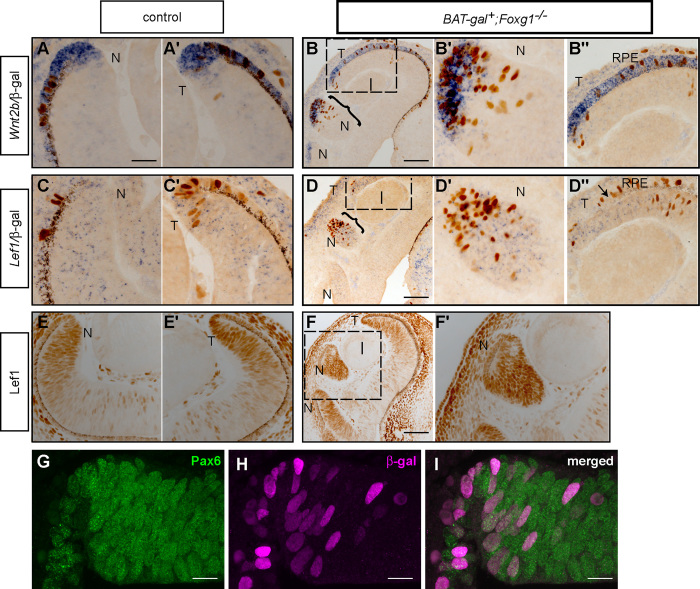
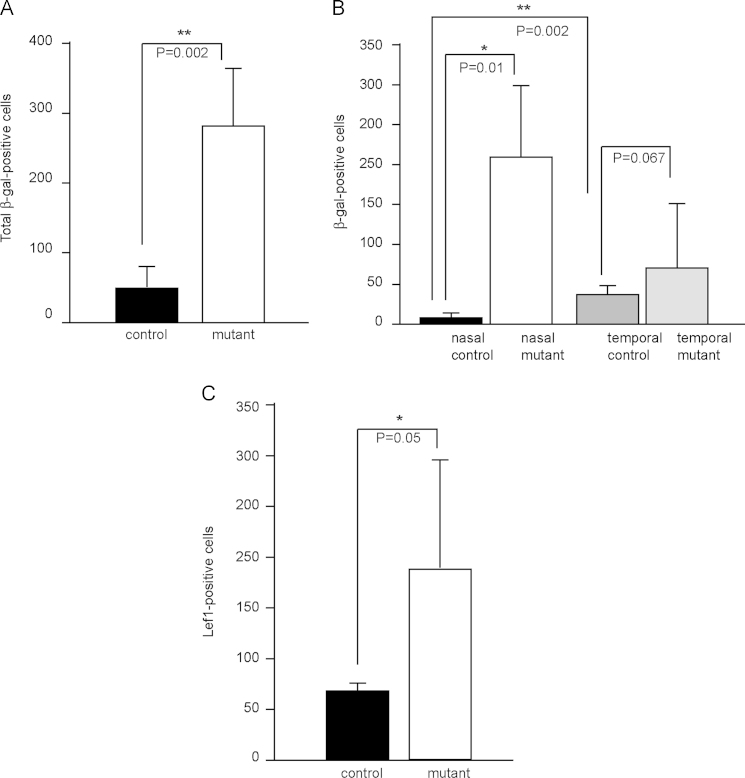
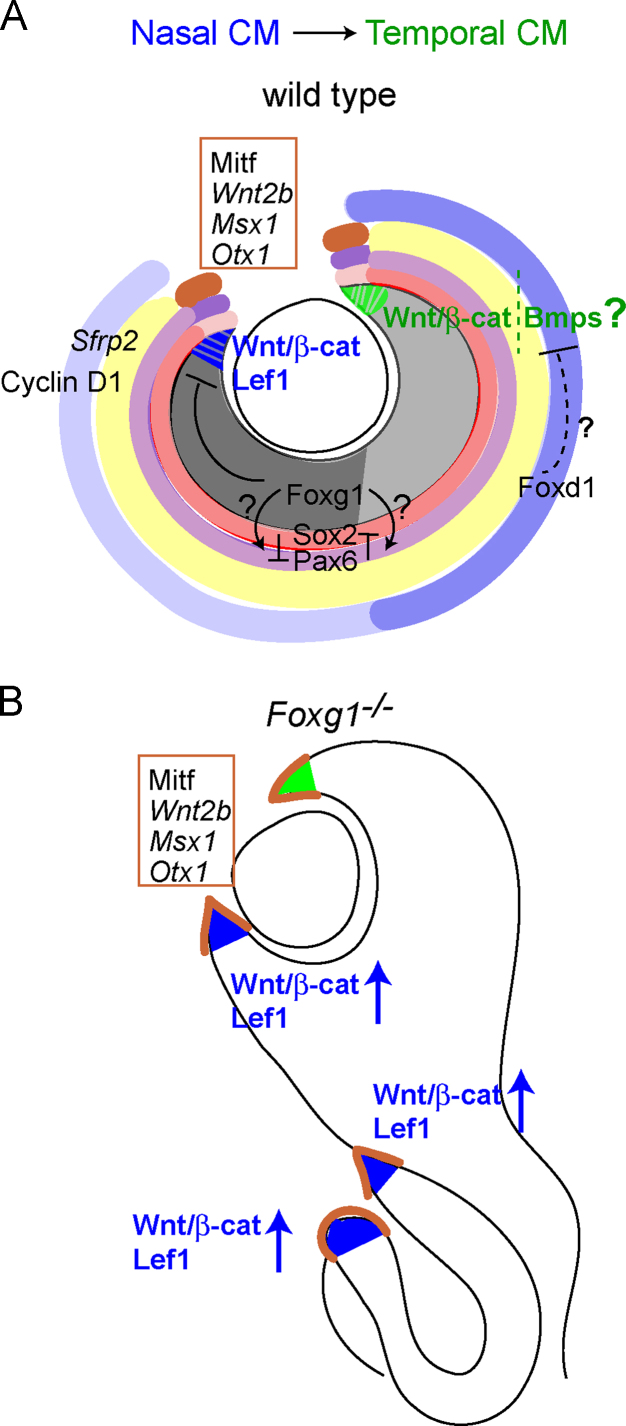
The ciliary margin (CM) develops in the peripheral retina and gives rise to the iris and the ciliary body. The Wnt/β-catenin signalling pathway has been implicated in ciliary margin development. Here, we tested the hypothesis that in the developing mouse retina Foxg1 is responsible for suppressing the Wnt/β-catenin pathway and restricting CM development. We showed that there is excess CM tissue in Foxg1(-/-) null embryos and this expansion is more pronounced in the nasal retina where Foxg1 normally shows its highest expression levels. Results on expression of a reporter allele for Wnt/β-catenin signalling and of Lef1, a target of Wnt/β-catenin signalling, displayed significant upregulation of this pathway in Foxg1(-/-) nulls at embryonic days 12.5 and 14.5. Interestingly, this upregulation was observed specifically in the nasal retina, where normally very few Wnt-responsive cells are observed. These results indicate a suppressive role of Foxg1 on this signalling pathway. Our results reveal a new role of Foxg1 in limiting CM development in the nasal peripheral retina and add a new molecular player in the developmental network involved in CM specification.

Keywords: Ciliary margin; Eye development; Foxg1; Mouse; Wnt/β-catenin signalling.


Figures

Suppl Fig. 1
Suppl Fig. 1
Markers of dorso-ventral retina patterning show normal expression in theFoxg1-/-mutant. In situ hybridisation for Bmp4 (A,A′), Tbx5 (B,B′) and Vax2 (C,C′) on E12.5 control (Foxg1+/+) (A–C) and mutant (Foxg1-/-) retinal sections (A′–C′). In situ hybridizations for Tbx5 and Vax2 are followed by immunohistochemistry for Mitf and Pax6 respectively (brown staining in (B–C′). Scale bar in (A) corresponds to 100 μm and applies to all panels.
Suppl Fig. 2
Suppl Fig. 2
Sox2 and Pax6 expression patterns are in agreement with an enlarged CM in theFoxg1-/-mutant. Immunofluorescence for Pax6 (green) and Sox2 (red) on E12.5 wild type (A–C) and Foxg1-/- mutant (A′–C′) horizontal sections. The arrow indicates a Pax6-positive;Sox2-negative area in the peripheral retina. Scale bar in (A) corresponds to 100 μm and applies to all panels.
Fig. 1
Fig. 1
Foxg1 retinal expression is graded from highnasal-to-low temporal. In situ hybridisation of Foxg1 on consecutive dorsal (D) to ventral (V) retinal E12.5 wild type sections (A–E). (F) and (G) are low power images of (A) and (C) respectively. (H) and (I) are high power images of the squared areas in (C). The dashed brackets in (H) and (I) indicate the approximate position of the ciliary margin (CM) N –> T in this and subsequent figures indicates the nasal-temporal axis. Abbreviations: Hy, hypothalamus; oc, optic chiasm; oe, olfactory epithelium; r, retina; Tel, telencephalon. Scale bars: A–E, 100 μm; F, G, 800 μm; H, I, 50 μm.
Fig. 2
Fig. 2
The morphology of the Foxg1/ mutant optic cup displays severe abnormalities. In situ hybridisation for Sfrp2 in control (Foxg1+/+) (A–E; F–I) and mutant (Foxg1/) (A′-E′; F′-L′) on consecutive dorsal (D) to ventral (V) E11.5 (A–E′) and E12.5 (F–L′) horizontal eye sections. Arrows in (B), (B′) and (C′) indicate the retinal pigment epithelium (RPE). The dotted square in (B) demarcates the high power inset, which allows the RPE to be distinguished from the strong Sfrp2 retinal staining. The dashed lines in (C′–E′) indicate the area of the optic cup that is not yet surrounded by RPE. Curly brackets in (D,D′) indicate the optic stalk (OS). The small-gapped dashed line in (D′) demarcates the continuation of tissue that is Sfrp2-negative. Brackets (H,H′,I′) demarcate Sfrp2-negative regions, which correspond to ciliary margin tissue. Arrows in (H′) point to the retinal pigment epithelium, which, by E12.5, surrounds the entire mutant optic cup, in both the temporal and nasal parts. Abbreviations: l, lens. Scale bar in (A) corresponds to 100 μm and applies for all panels (A–L′).
Fig. 3
Fig. 3
Additional ciliary margin (CM) tissue in Foxg1/E12.5 mutants. Immunofluorescence for Mitf in controls (Foxg1+/+) (A) and mutants (Foxg1/) (A′). In situ hybridisation for Sfrp2 in controls (B) and mutants (B′). Immunohistochemistry for Cyclin D1 in controls (C) and mutants (C′) and for Sox2 in controls (D) and mutants (D′). Images (A–A′) are counterstained with DAPI (blue staining) and (C–C′) with cresyl violet. Sections (A,A′) are adjacent to sections (B,B′) respectively and (C,C′) to (D,D′) respectively. Squared areas in panels (A–B′) are depicted in a high power image to the right of each panel. Curly brackets indicate ciliary margin sites. Scale bars: (A–B′) low power images, 100 μm; high power images, 50 μm; (C–D′), 100 μm. (For interpretation of the references to colour in this figure legend, the reader is referred to the web version of this article.)
Fig. 4
Fig. 4
The cell cycle properties of the Foxg1/ peripheral retina resemble those of CM-like tissue. Immunohistochemistry for BrdU (A,A′) and Otx1 (B,B′) in E11.5 control (Foxg1+/+) (A,B) and mutant (Foxg1/) (A′,B′) horizontal retinal sections. Sections in (A,A′) are counterstained with cresyl violet. The counting bins used to calculate the labelling indices are shown in red; green dots represent the labelled BrdU-positive cells and pink dots the unlabelled cells (cresyl violet-positive) (A,A′). The labelling indices (fraction of BrdU-positive cells during a 30 min period) are plotted as average values from at least 3 different wild type (Foxg1+/+) and mutant (Foxg1/) retinas (C). The labelling indices were calculated within three consecutive counting bins in the peripheral retina (Bin 1 corresponds to the most peripheral bin). Error bars indicate standard deviation. (For interpretation of the references to colour in this figure legend, the reader is referred to the web version of this article.)
Fig. 5
Fig. 5
Evidence for additional ciliary margin (CM) sites in E14.5 Foxg1/ retinas. Immunofluorescence for Mitf (red) (A,A′,E,E′) and GFP (green) (B,B′,F,F′) in E14.5 horizontal retinal sections. Mitf is expressed in the retinal pigment epithelium (RPE) and in the most anterior tip of the control CM (A,A′). Strong GFP staining is found in the RPE and the entire CM of controls (B,B′). GFP and Mitf overlap in the RPE and partially overlap in the control CM (D,D′). In the null Foxg1/ retina there is Mitf staining in the RPE and the tips of the CM (E,E′) and intense GFP staining in the RPE and the entire CM (F,F′). Additional sites of GFP expression are found near the retinal folds (curly brackets in H,H′). These GFP-positive sites only partially express Mitf (E,E′). (C,C′) and (G,G′) are the control and mutant sections respectively counterstained with DAPI (blue). Panels (A′–D′) and (E′–H′) are high power images of the squared areas in (B) and (F) respectively. The dashed lines in (A) and (E) indicate the nasal (N) – temporal (T) divide in the control and the Foxg1/ mutant respectively. Scale bar in (A) corresponds to 200 μm and applies for panels (A–D) and (E–H). Scale bar in (A′) corresponds to 50 μm and applies for panels (A′–D′) and (E′–H′).
Fig. 6
Fig. 6
Additional ciliary margin (CM) tissue in E14.5 Foxg1/ retinas. Otx1 protein expression in the ciliary margin (CM) of control (Foxg1+/+) (A) and mutant (Foxg1/) (A′) retinas, indicated by brackets. In Foxg1/ mutants, additional sites of Otx1 expression surround retinal folds (curly brackets in A′). Immunostaining for Vsx2 in controls (B) and mutants (B′) revealing normal retinal progenitor proliferation, even in the mutant folds. Msx1 mRNA expression in the CM of control and mutant retinas is in agreement with that of Otx1. Msx1 is found in the CM margin of controls (C) and mutants (C′) and in additional sites in mutants (C′′). The Msx1 positive sites correspond to the indicated sites in panels A (for C) and A′ (for C′, and C′′). The dashed lines in (A) and (A′) indicate the nasal (N) – temporal (T) divide in the control and the Foxg1/ mutant respectively. Abbreviations: l, lens. Scale bar in (A) corresponds to 200 μm and applies for panels (A–B′). Scale bar in (C) corresponds to 25 μm and applies for panels (C–C′′).
Fig. 7
Fig. 7
Upregulation of Wnt/β-catenin signalling in the nasal ciliary margin (CM) of E12.5 BAT-gal+; Foxg1/ compound mutants. Horizontal E12.5 retinal sections were studied by in situ hybridisation for Wnt2b (A–B′′) and Lef1 (C–D′′) followed by immunohistochemistry for β-galactosidase (β-gal) in controls (A,A′,C,C′) and compound mutants (B–B′′and D–D′′). Immunohistochemistry for Lef1 in controls (E,E′) and Foxg1/ mutants (F–F′). Panels (A,B′,C,D′,E,F′) correspond to the nasal (N) and (A′,B′′,C′,D′′,E′) to the temporal (T) side of the same eye. The curly brackets in (B) and (D) indicate the nasal retinal folds shown in high power in panels (B′) and (D′) respectively, while the dotted squares indicated the temporal retina shown in high power in panels (B′′) and (D′′) respectively. The arrow in (D′′) indicates the start of the retinal pigment epithelium (RPE) in the temporal mutant retina. The dotted square in (F) delineates the high power image of the nasal folded retina in (F′). Immunofluorescence for Pax6 (green) (G), β-galactosidase (magenta) (H) and Pax6/β-galactosidase (I) on E12.5 BAT-gal+; Foxg1/ compound mutant retinas. Scale bar in (A) corresponds to 50 μm and applies for panels (A,A′,B′,B′′,C,C′,D′,D′′,E,E′,F′); (B,D,F), 100 μm; (G–I), 20 μm. Abbreviations: l, lens.
Fig. 8
Fig. 8
Cell counts for immunopositive cells for downstream targets of the Wnt/β-catenin pathway. Counts for total number of β-gal-positive cells (A) and β-gal-positive cells in the nasal and temporal retina (B). Counts for Lef1-positive cells in the nasal retina (C). Bars represent the median value of cell counts from at least 3 different retinas per genotype (Mann–Whitney test). Error bars indicate standard deviation.
Fig. 9
Fig. 9
Schematic diagram of the proposed role of Foxg1 in CM development. Graded expression of Foxg1 in the retina is shown in grey with a strong grey shade in the nasal and a lighter one in the temporal component of a wild type (Foxg1+/+) where Foxg1 normally represses the Wnt/β-catenin signalling pathway in the nasal CM (A). Specification of the temporal CM may require the Wnt/β-catenin and/or the Bmp signalling pathways. Foxd1, depicted in graded blue, may restrict expansion of temporal CM fates (A). The high-to-low gradient of expression of Sox2 and that of low-to-high of Pax6 from the central to the peripheral retina are shown in shades of red and purple respectively (A). The yellow shade depicts expression of the central retina markers Sfrp2 and Cyclin D1 examined in this study (A). The CM markers studied are represented in brown in both the wild type (A) and mutant (Foxg1/) (B). In the mutant, Wnt/β-catenin signalling is upregulated and the nasal retina is expanded abnormally (B). (For interpretation of the references to colour in this figure legend, the reader is referred to the web version of this article.)

References

    1. Amae S., Fuse N., Yasumoto K., Sato S., Yajima I., Yamamoto H., Udono T., Durlu Y.K., Tamai M., Takahashi K., Shibahara S. Identification of a novel isoform of microphthalmia-associated transcription factor that is enriched in retinal pigment epithelium. Biochem. Biophys. Res. Commun. 1998;247:710–715. - PubMed
    1. Barolo S. Transgenic Wnt/TCF pathway reporters: all you need is Lef? Oncogene. 2006;25:7505–7511. - PubMed
    1. Behesti H., Holt J.K., Sowden J.C. The level of BMP4 signaling is critical for the regulation of distinct T-box gene expression domains and growth along the dorso-ventral axis of the optic cup. BMC Dev. Biol. 2006;6:62. - PMC - PubMed
    1. Burns C.J., Zhang J., Brown E.C., Van Bibber A.M., Van Es J., Clevers H., Ishikawa T.O., Taketo M.M., Vetter M.L., Fuhrmann S. Investigation of Frizzled-5 during embryonic neural development in mouse. Dev. Dyn. 2008;237:1614–1626. - PMC - PubMed
    1. Carreres M.I., Escalante A., Murillo B., Chauvin G., Gaspar P., Vegar C., Herrera E. Transcription factor Foxd1 is required for the specification of the temporal retina in mammals. J. Neurosci. 2011;31:5673–5681. - PMC - PubMed

Publication types

MeSH terms

LinkOut - more resources