. 2013 Jul;79(13):4031-40.
doi: 10.1128/AEM.00095-13. Epub 2013 Apr 26.

Evidence of microbial regulation of biogeochemical cycles from a study on methane flux and land use change

Affiliations

Evidence of microbial regulation of biogeochemical cycles from a study on methane flux and land use change

Loïc Nazaries et al. Appl Environ Microbiol. 2013 Jul.

Abstract

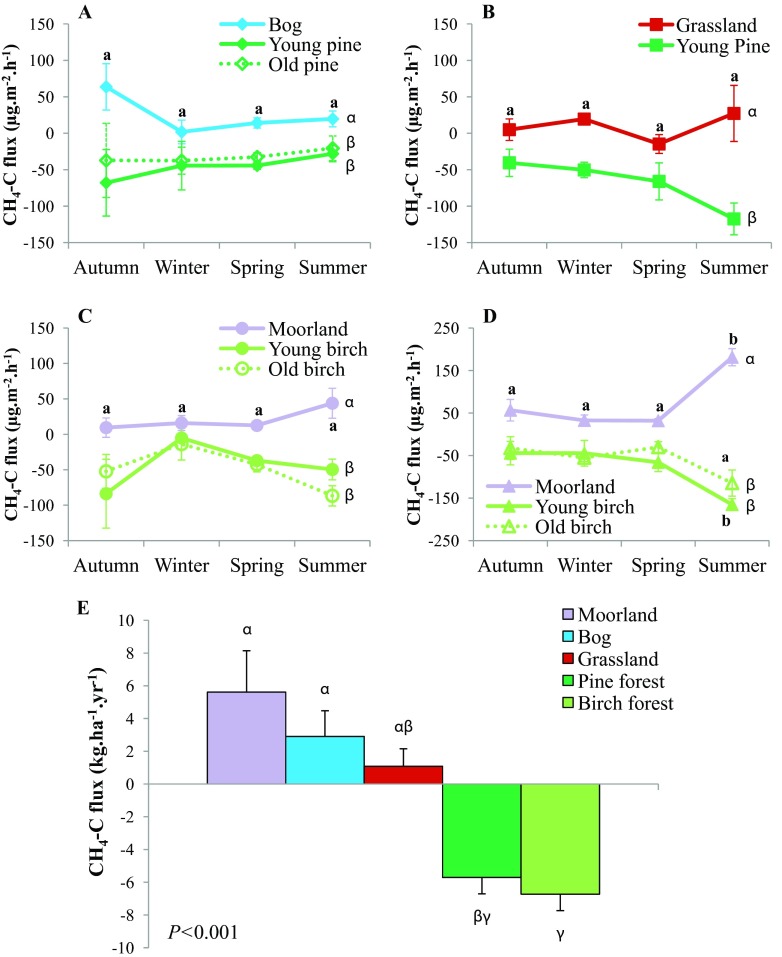
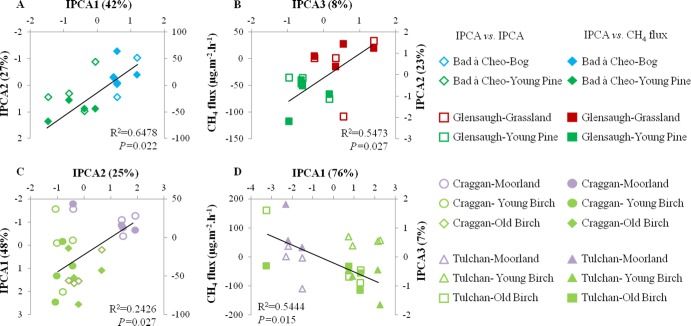
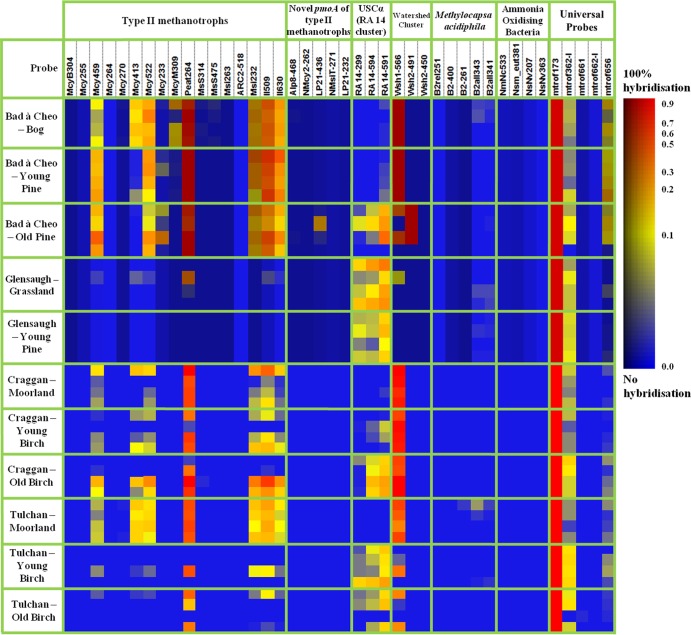
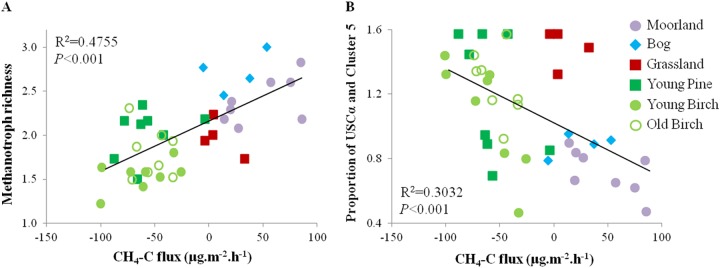
Microbes play an essential role in ecosystem functions, including carrying out biogeochemical cycles, but are currently considered a black box in predictive models and all global biodiversity debates. This is due to (i) perceived temporal and spatial variations in microbial communities and (ii) lack of ecological theory explaining how microbes regulate ecosystem functions. Providing evidence of the microbial regulation of biogeochemical cycles is key for predicting ecosystem functions, including greenhouse gas fluxes, under current and future climate scenarios. Using functional measures, stable-isotope probing, and molecular methods, we show that microbial (community diversity and function) response to land use change is stable over time. We investigated the change in net methane flux and associated microbial communities due to afforestation of bog, grassland, and moorland. Afforestation resulted in the stable and consistent enhancement in sink of atmospheric methane at all sites. This change in function was linked to a niche-specific separation of microbial communities (methanotrophs). The results suggest that ecological theories developed for macroecology may explain the microbial regulation of the methane cycle. Our findings provide support for the explicit consideration of microbial data in ecosystem/climate models to improve predictions of biogeochemical cycles.


Figures

Fig 1
Fig 1
(A to D) Seasonal net CH4-C fluxes from soils at Bad à Cheo (A), Glensaugh (B), Craggan (C), and Tulchan (D); (E) yearly CH4 flux estimates from the nonforested and forested habitats. A positive value means that a production of CH4 occurs, whereas a negative flux denotes a sink of CH4. (A to D) The curves represent the flux means (error bars are standard errors of the means [SEM]; n = 4) of each season for each habitat from the closed-chamber experiment. Significance was analyzed through a nested ANOVA (land use by season). (E) Each histogram represents the yearly net CH4 flux average ± the SEM (n = 4 replicates) based on the upscaling of seasonal net CH4-C flux measurements. Data from the four sampling sites (Bad à Cheo, Glensaugh, Craggan, and Tulchan) which had similar land uses (bog, grassland, heathland, pine forest, or birch forest) were combined during upscaling. The method used for upscaling can be found within the text. For each site, statistical differences between seasons within each habitat are indicated by different Roman letters (a, b), while Greek letters (α, β, γ) indicate statistical differences between land uses according to multiple pairwise comparisons (α = 0.05).
Fig 2
Fig 2
Relationship between CH4 flux and methanotrophic community structure at Bad à Cheo (A), Glensaugh (B), Craggan (C), and Tulchan (D). The empty shapes (IPCA versus IPCA) are data points representing the IPC scores after analysis of the pmoA-based T-RFLP profiles with the AMMI model. The filled shapes (IPCA versus CH4 flux) are data points corresponding to the strongest linear regression of the net seasonal CH4 fluxes (Fig. 1A to D) with one of the IPC scores. The data points within each habitat represent the averages over replicates (n = 4) of the IPC scores of each season.
Fig 3
Fig 3
Community analysis of type II methanotrophs and related organisms using the pmoA microarray (n = 44). Within each habitat, each row represents a replicate. The results were normalized first to the positive-control probe mtrof173 and then to the reference values determined individually for each probe (29). Color coding is as follows: red color indicates the maximum achievable signal for an individual probe, while blue color indicates that no detectable PCR product hybridized to that probe. The color gradient between blue and red reflects the proportion of hybridization.
Fig 4
Fig 4
Relationships between methanotroph diversity and changes in CH4 flux associated with land use treatment (n = 4 replicates). (A) The methanotroph richness (or OTU richness) was calculated as the square root transformation of the number of T-RFs present in each sample (among the 15 most abundant T-RFs of the T-RFLP profiles, which constituted >94% coverage). (B) Proportions of USCα and cluster 5 microorganisms were calculated as the angular transformation (arcsine of the square root) of the ratio of the relative abundance of the T-RFs specific to Methylocapsa sp. (USCα/cluster 5; T-RFs Hha-32 and Hha-129) to the sum of the T-RFs specific to USCα/cluster 5 and the Methylocystaceae family (T-RF Hha-81). Refer to Table 1 for T-RF reference values.

References

    1. Gans J, Wolinsky M, Dunbar J. 2005. Computational improvements reveal great bacterial diversity and high metal toxicity in soil. Science 309:1387–1390 - PubMed
    1. Harris J. 2009. Soil microbial communities and restoration ecology: facilitators or followers? Science 325:573–574 - PubMed
    1. Isbell F, Calcagno V, Hector A, Connolly J, Harpole WS, Reich PB, Scherer-Lorenzen M, Schmid B, Tilman D, van Ruijven J, Weigelt A, Wilsey BJ, Zavaleta ES, Loreau M. 2011. High plant diversity is needed to maintain ecosystem services. Nature 477:199–202 - PubMed
    1. Reich PB, Tilman D, Naeem S, Ellsworth DS, Knops J, Craine J, Wedin D, Trost J. 2004. Species and functional group diversity independently influence biomass accumulation and its response to CO2 and N. Proc. Natl. Acad. Sci. U. S. A. 101:10101–10106 - PMC - PubMed
    1. Reich PB, Tilman D, Isbell F, Mueller K, Hobbie SE, Flynn DF, Eisenhauer N. 2012. Impacts of biodiversity loss escalate through time as redundancy fades. Science 336:589–592 - PubMed

Publication types

LinkOut - more resources