Abstract

The differentiation of hematopoietic stem cells into cells of the immune system has been studied extensively in mammals, but the transcriptional circuitry that controls it is still only partially understood. Here, the Immunological Genome Project gene-expression profiles across mouse immune lineages allowed us to systematically analyze these circuits. To analyze this data set we developed Ontogenet, an algorithm for reconstructing lineage-specific regulation from gene-expression profiles across lineages. Using Ontogenet, we found differentiation stage-specific regulators of mouse hematopoiesis and identified many known hematopoietic regulators and 175 previously unknown candidate regulators, as well as their target genes and the cell types in which they act. Among the previously unknown regulators, we emphasize the role of ETV5 in the differentiation of γδ T cells. As the transcriptional programs of human and mouse cells are highly conserved, it is likely that many lessons learned from the mouse model apply to humans.


Figures

Figure 1
Figure 1
Mouse cell populations in the ImmGen Compendium. Shown is the lineage tree of the hematopoietic mouse cell types profiled by the Immunological Genome consortium (www.immgen.org). Some stem, progenitor and B cells were sampled from adult and fetal liver. Stromal cells (box, bottom right) were also measured as part of ImmGen, but are not part of the lineage tree. The markers used to sort each cell population are listed (Supplementary Table 1). Adapted from .
Figure 2
Figure 2
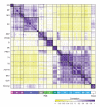
Related cells have highly similar expression profiles. Shown are the Pearson correlation coefficients (purple – positive correlation; yellow – negative correlation; white – no correlation) between each pair of profiled cell types, calculated across the 1,000 genes (of the 8431 unique expressed genes) with the highest standard deviation across all samples. Black lines delineate major lineages. GN – granulocytes, MF – macrophages, MO – monocytes, DC – dendritic cells, S&P – stem and progenitor cells, PROB – preB and proB cells, NK – natural killer cells, T4 – CD4+ T cells, T8 – CD8+ T cells, ACTT8 – activated CD8+ T cells, NKT – natural killer T cells, GDT – gamma delta T cells. Samples are sorted by breadth-first search on the tree in Fig. 1, with stromal cells at the lower or right end.
Figure 3
Figure 3
Overview of Ontogenet. (a) Different types of regulators (bottom) can explain the expression of a module (top). For each regulator, we display its expression profile (blue/red vectors) and activity profile (orange/purple vectors). A regulator may have a uniform positive activity weight across the lineage (constitutive activator, top), a uniform negative activity weight (constitutive repressor, middle), or variable activity weights (context-specific regulator, bottom). (b) The mean expression of a module (top) is a linear combination of regulator expression (blue red patterns, left) and activity level (orange/purple patterns, right).
Figure 4
Figure 4
Ontogenet regulatory model for coarse–grained module C33. (a) Module C33. Shown is the mean centered expression (red blue color bar, bottom) of the module’s genes (rows) in each cell (column). The major lineages are noted at the bottom, and marked by thin vertical lines. Fine modules F175-F181 nested within C33 are separated by thin horizontal lines and labeled. Example gene names are noted on left. (b) Regulators expression. Shown are the mean centered expression levels (red blue color bar, bottom) of the regulators (rows) assigned by Ontogenet to module C33. (c) Regulators activity weights. Shown are the activity weights (orange purple color bar, bottom) for each of the Ontogenet assigned regulators from (b) in each cell type. (d) Mean-centered mean expression of module C33 is projected onto the hematopoietic tree. Low expression is blue, high expression is red. Selected members are listed below. Selected inferred regulators are marked by arrowhead at the edges in which their activity weight changes. This module contains some typical B cells genes, including Cd19, Blnk, Ebf1, and Cd79a.
Figure 5
Figure 5
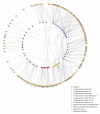
Ontogenet regulatory model for coarse-grained modules. Shown are lineage specific modules (colored as in Figure 2, except myeloid induced modules, dark purple), pan-differentiation induced (red) and repressed (gray) modules and mixed-used modules (yellow) (all in inner circle), and their Ontogenet assigned regulators (outer circle, cream) with regulatory interactions with maximal effect (absolute activity weight*expression) bigger than 1. An edge connects each regulator to the module(s) it regulates.
Figure 6
Figure 6
Changes in activity weights across the hematopoietic lineage tree. (a) High changing interactions. Shown are the activity weights in each cell type (column) for every highly changing regulatory interaction between a regulator and a coarse-grained module. Orange: positive (activation) activity weight; Purple: negative (repression) activity weight; White: zero (no regulation). The major lineages are noted by the color bar (bottom). (b) High changing interactions in the CD8+ T cell lineage. Shown is a zoom in (from a) only for those activating interactions that are recruited within the CD8+ T cell lineage. (c) Known and novel regulators recruited in the CD8+ T cell lineage. Shown is the CD8+ T cell lineage branch (squares: cell types; edges: differentiation steps) labeled with the regulators recruited along each differentiation step and their associated modules. Regulators previously reported to have a role in T cells are marked in red. The number of activity weight changes for the regulator on this edge, if more than one, is shown in parentheses. (d) Ontogenet-inferred lineage regulators. Shown is a reduced ImmGen tree with the lineage regulators. Regulators previously reported to have a role in that lineage are marked red.
Figure 7
Figure 7
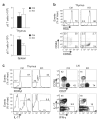
ETV5 is a γδ T cell regulator. (a) Relatively normal total numbers of γδ T cells are generated in ETV5 conditional KO (CKO) mice. In 7 day old neonates, total thymocyte numbers of CKO mice are decreased to ~50% of normal, but the frequency of γδTCR+ thymocytes is increased by ~ 2 fold, resulting in similar numbers of γδ T cells in the thymus and spleen as controls. One representative of three independent litters analyzed with a minimum of two mice/genotype is shown. Control (Ctrl) mice are CD2p-CreTg+Etv5+/+ littermates. (b) Altered maturation of Vγ2+ thymocytes. Top, Decreased numbers of mature HSA (CD24)lo Vγ2+ thymocytes in 7 day old CKO mice. Bottom, Decreased activation of Vγ2+ thymocytes in CKO mice as indicated by the paucity of CD44+ cells. For γδTCR+ thymocytes expressing other Vγ chains, the proportions of mature cells or activated cells in CKO mice were not different from controls. Similar results were observed in mice of different ages. (c) Impairment in the capacity to produce IL-17 effector cytokine by Vγ2+ cells. Left panels, decreased expression of IL-17 inducing transcription factor RORγt and corresponding decrease in IL-17 production by mature (CD24lo) Vγ2+ thymocytes in CKO mice. No significant difference in RORγt expression was observed in immature (CD24hi) Vγ2+ thymocytes. Right panels, decreased frequencies and numbers of peripheral CCR6+CD27IL-17+, and a reciprocal increase in CD27+ IFNγ producing Vγ2+ lymph node (LN) T cells in CKO mice (4 wk old). Data are representative of five experiments.

Comment in

  • Deconstructing development.
    Harly C, Wherry EJ, Bhandoola A. Harly C, et al. Nat Immunol. 2013 Jun;14(6):529-31. doi: 10.1038/ni.2613. Nat Immunol. 2013. PMID: 23685815 No abstract available.

References

    1. Shay T, Jojic V, Zuk O, Rothamel K, Puyraimond-Zemmour D, Feng T, Wakamatsu E, Benoist C, Koller D, Regev A, ImmGen Consortium Conservation and divergence in the transcriptional programs of the human and mouse immune systems. Proceedings of the National Academy of Sciences. 2013;110(8):2946–2951. - PMC - PubMed
    1. Heng TSP, Painter MW, Elpek K, Lukacs-Kornek V, Mauermann N, Turley SJ, Koller D, Kim FS, Wagers AJ, Asinovski N, Davis S, Fassett M, Feuerer M, Gray DHD, Haxhinasto S, Hill JA, Hyatt G, Laplace C, Leatherbee K, Mathis D, Benoist C, Jianu R, Laidlaw DH, Best JA, Knell J, Goldrath AW, Jarjoura J, Sun JC, Zhu Y, Lanier LL, Ergun A, Li Z, Collins JJ, Shinton SA, Hardy RR, Friedline R, Sylvia K, Kang J. The Immunological Genome Project: networks of gene expression in immune cells. Nat Immunol. 2008;9(10):1091–1094. - PubMed
    1. Iwasaki H, Akashi K. Myeloid Lineage Commitment from the Hematopoietic Stem Cell. Immunity. 2007;26(6):726–740. - PubMed
    1. Novershtern N, Subramanian A, Lawton LN, Mak RH, Haining WN, McConkey ME, Habib N, Yosef N, Chang CY, Shay T, Frampton GM, Drake ACB, Leskov I, Nilsson B, Preffer F, Dombkowski D, Evans JW, Liefeld T, Smutko JS, Chen J, Friedman N, Young RA, Golub TR, Regev A, Ebert BL. Densely Interconnected Transcriptional Circuits Control Cell States in Human Hematopoiesis. Cell. 2011;144(2):296–309. - PMC - PubMed
    1. Kim HD, Shay T, O’Shea EK, Regev A. Transcriptional Regulatory Circuits: Predicting Numbers from Alphabets. Science. 2009;325(5939):429–432. - PMC - PubMed

Publication types

MeSH terms

Associated data