. 2013 Jun;14(6):554-63.
doi: 10.1038/ni.2586. Epub 2013 Apr 28.

Mast cell maturation is driven via a group III phospholipase A2-prostaglandin D2-DP1 receptor paracrine axis

Affiliations

Mast cell maturation is driven via a group III phospholipase A2-prostaglandin D2-DP1 receptor paracrine axis

Yoshitaka Taketomi et al. Nat Immunol. 2013 Jun.

Abstract

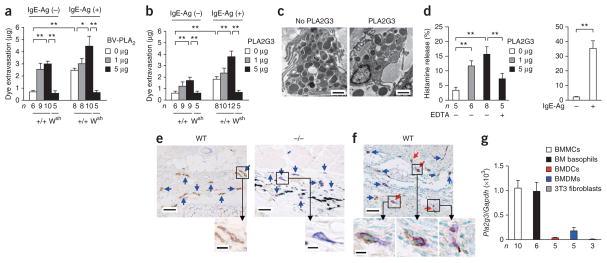
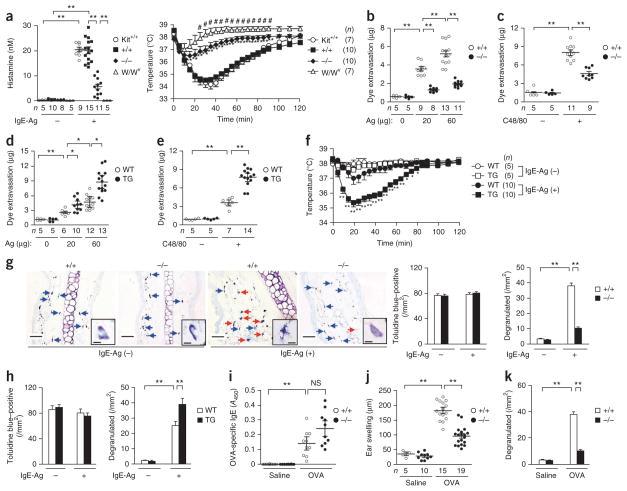
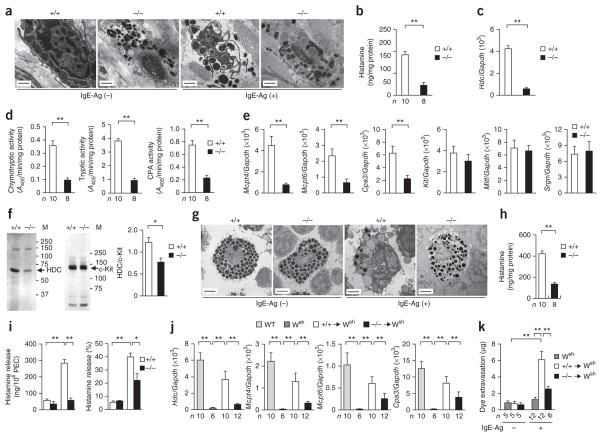
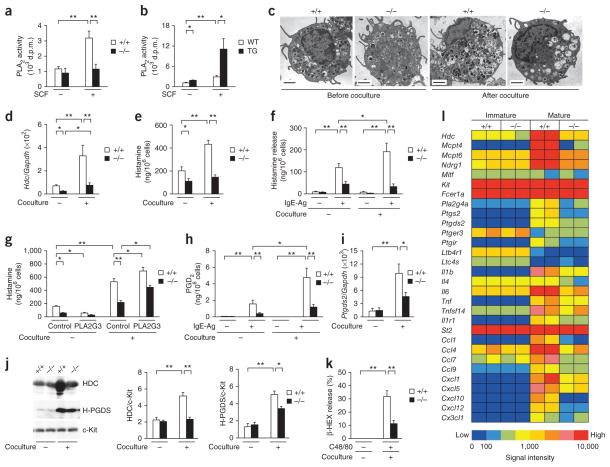
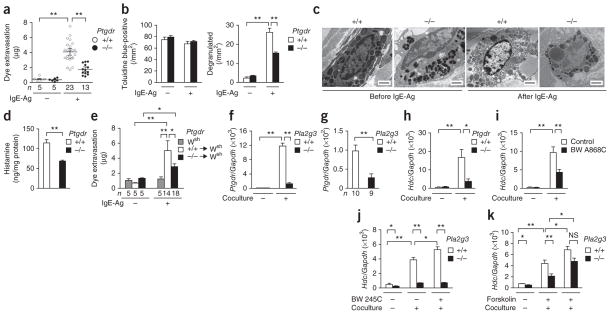
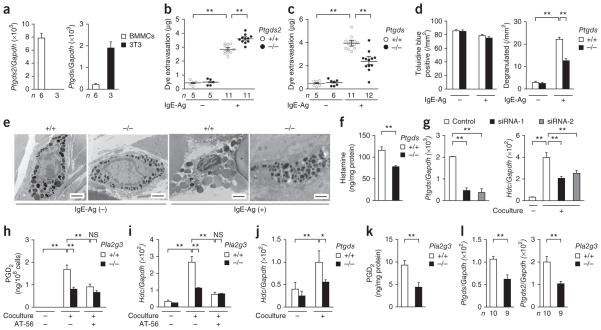
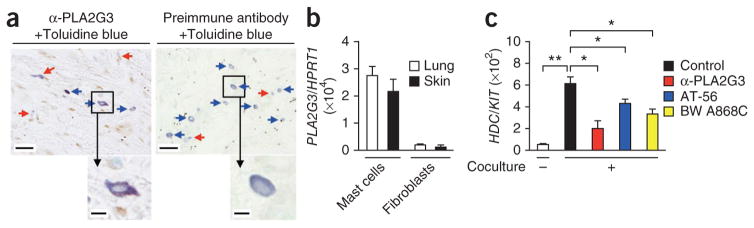
Microenvironment-based alterations in phenotypes of mast cells influence the susceptibility to anaphylaxis, yet the mechanisms underlying proper maturation of mast cells toward an anaphylaxis-sensitive phenotype are incompletely understood. Here we report that PLA2G3, a mammalian homolog of anaphylactic bee venom phospholipase A2, regulates this process. PLA2G3 secreted from mast cells is coupled with fibroblastic lipocalin-type PGD2 synthase (L-PGDS) to provide PGD2, which facilitates mast-cell maturation via PGD2 receptor DP1. Mice lacking PLA2G3, L-PGDS or DP1, mast cell-deficient mice reconstituted with PLA2G3-null or DP1-null mast cells, or mast cells cultured with L-PGDS-ablated fibroblasts exhibited impaired maturation and anaphylaxis of mast cells. Thus, we describe a lipid-driven PLA2G3-L-PGDS-DP1 loop that drives mast cell maturation.


Conflict of interest statement

COMPETING FINANCIAL INTERESTS

The authors declare no competing financial interests.

Figures

Figure 1
Figure 1
PLA2G3 is expressed in mast cells and has the ability to induce degranulation. (a,b) Quantification of ear edema in IgE-sensitized Kit+/+ (+/+) or KitW-sh/W-sh (Wsh) mice 30 min after intradermal injection with 0 μg, 1 μg or 5 μg of BV-PLA2 (a) or human PLA2G3 (b) in the presence (IgE-Ag (+)) or absence (IgE-Ag (−)) of 20 ng of antigen. (c) Transmission electron microscopy of ear mast cells in wild-type mice with (+) or without (−) administration of 5 μg of PLA2G3. Scale bars, 2 μm. (d) Histamine release from wild-type mouse peritoneal cells after treatment for 30 min with 0 μg, 1 μg or 5 μg of PLA2G3 in the presence or absence of 2 mM EDTA (left). Histamine release by IgE-Ag stimulation (positive control) is also shown (right). (e,f) Immunohistochemistry analysis of ear-skin sections of wild-type (WT) or Pla2g3−/− (−/−) mice before (e) and 2 min after (f) stimulation with IgE-Ag with anti-PLA2G3 (α-PLA2G3), followed by counterstaining with toluidine blue (scale bars, 50 μm). Boxed areas are magnified below (scale bars, 5 μm). Blue and red arrows indicate resting and degranulated mast cells, respectively. (g) Real-time PCR of Pla2g3 relative to Gapdh in indicated bone marrow–derived cells from wild-type mice and Swiss 3T3 fibroblasts. Data are from one experiment (g), and compiled from two (d) and three (a,b) experiments (mean ± s.e.m.; *P < 0.05 and **P < 0.01). Data in c,e,f are representative of two experiments.
Figure 2
Figure 2
Altered anaphylaxis in mice with deletion or overexpression of PLA2G3. (a) Serum histamine concentrations (left) and rectal temperatures (right) in IgE-Ag–dependent PSA in Pla2g3+/+ (+/+), Pla2g3−/− (−/−), WBB6F1-Kit+/+ (Kit+/+) and WBB6F1-KitW/W-v (W/Wv) mice after challenge with 500 μg of antigen (Ag). *P < 0.05 and **P < 0.01, Pla2g3−/− versus Pla2g3+/+ mice and #P < 0.05, KitW/W-v versus Pla2g3−/− mice (right). (be) Analysis of ear edema in IgE-Ag–induced (b,d) or C48/80–induced (c,e) PCA in Pla2g3+/+ (+/+) and Pla2g3−/− (−/−) mice (b,c) or wild-type (WT) and PLA2G3tg/+ (TG) mice (d,e). (f) Rectal temperatures in IgE-Ag–dependent PSA in wild-type (WT) and PLA2G3tg/+ (TG) mice after challenge with antigen (25 μg). *P < 0.05 and **P < 0.01, WT versus TG after antigen challenge. (g,h) Toluidine blue staining of skin sections (left) and counts of toluidine blue+ total and degranulated dermal mast cells (right) in Pla2g3+/+ (+/+) and Pla2g3−/− (−/−) mice (g) or wild-type (WT) and PLA2G3tg/+ (TG) mice (h) before (IgE-Ag (−)) and 2 min after (IgE-Ag (+)) IgE-Ag–mediated PCA (scale bars, 50 μm) (n = 6). Blue and red arrows indicate resting and degranulated mast cells, respectively (g). Insets, magnified images (scale bars, 5 μm) (g). (ik) Serum levels of OVA-specific IgE (n = 10; i), ear swelling (j) and numbers of degranulated ear mast cells (n = 6; k) in OVA-induced active cutaneous anaphylaxis in Pla2g3+/+ (+/+) and Pla2g3−/− (−/−) mice. Data are from one experiment (fi,k) and compiled from three experiments (ae,j) (mean ± s.e.m., *P < 0.05; **P < 0.01; NS, not significant).
Figure 3
Figure 3
Immature properties of tissue mast cells in Pla2g3-deficient mice. (a) Transmission electron micrographs of ear mast cells in Pla2g3+/+ (+/+) and Pla2g3−/− (−/−) mice before (IgE-Ag (−)) and 2 min after (IgE-Ag (+)) antigen (Ag) challenge. Scale bars, 2 μm. (b,c) Quantification of histamine amounts (b) and Hdc mRNA expression relative to that of Gapdh (n = 12; c) in ears of Pla2g3+/+ (+/+) and Pla2g3−/− (−/−) mice. (d,e) Quantification of protease activity (d) and mRNA expression of mast cell proteases (n = 12) and other mast-cell markers (n = 7) (e) in ears of Pla2g3+/+ (+/+) and Pla2g3−/− (−/−) mice. (f) Immunoblotting of HDC and c-Kit in ears of Pla2g3+/+ (+/+) and Pla2g3−/− (−/−) mice. M, molecular mass (kDa). The ratio of HDC/c-Kit was quantified by densitometric analysis (n = 4). (g) Transmission electron micrographs of pMCs in Pla2g3+/+ (+/+) and Pla2g3−/− (−/−) mice before (IgE-Ag (−)) and 2 min after (IgE-Ag (+)) stimulation with antigen. Scale bars, 2 μm. (h,i) Quantification of histamine content (h) and IgE-Ag–induced histamine release (quantity and percentage; i) in Pla2g3+/+ (+/+) and Pla2g3−/− (−/−) pMCs. PEC, peritoneal cells. (j,k) Expression of mast-cell marker mRNAs (j) and dye extravasation in IgE-Ag–dependent PCA (k) in ears of Pla2g3+/+ (+/+) or Pla2g3−/− (−/−) BMMC-reconstituted or nonreconstituted KitW-sh/W-sh (Wsh) mice and wild-type (WT) Kit+/+ mice. Data are compiled from two (d,h,i) or three (b,c,e,j,k) experiments (mean ± s.e.m., *P < 0.05; **P < 0.01). Images are representative of one (f) or two (a,g) experiments.
Figure 4
Figure 4
Defective fibroblast-driven maturation of Pla2g3−/− BMMCs. (a,b) Release of sPLA2 activity from Pla2g3+/+ (+/+) and Pla2g3−/− (−/−) BMMCs (a) or from PLA2G3tg/+ (TG) and wild-type (WT) BMMCs (b) with or without 100 ng/ml SCF for 30 min (n = 4). d.p.m., disintegrations per minute. (c) Transmission electron microscopy of Pla2g3+/+ (+/+) and Pla2g3−/− (−/−) BMMCs before and on day 4 of coculture with Swiss 3T3 fibroblasts. Scale bars, 2 μm. (dk) Expression of Hdc relative to Gapdh (n = 8; d), cellular histamine levels (n = 8; e), histamine release with (IgE-Ag (+)) or without (IgE-Ag (−)) antigen challenge (n = 8; f), cellular histamine levels after culture in the presence or absence (control) of 2 μg/ml human PLA2G3 (n = 6; g), PGD2 generation with or without antigen challenge (n = 8; h), Ptgds2 expression (n = 8; i), immunoblot of HDC (n = 6) and H-PGDS (n = 3) relative to c-Kit (j) and C48/80-induced β-HEX release (n = 7; k) in Pla2g3+/+ (+/+) or Pla2g3−/− (−/−) BMMCs before (−) and on day 4 of (+) coculture. (l) Microarray gene profile of Pla2g3+/+ (+/+) and Pla2g3−/− (−/−) BMMCs before immature and on day 4 of mature coculture. Results from duplicate experiments are shown (columns). Heat maps are globally normalized for all genes. Data are from one experiment (a,b,l) and compiled from two (d,e,g,j,k) or three (f,h,i) experiments (mean ± s.e.m., *P < 0.05; **P < 0.01). Images in c are representative of two experiments.
Figure 5
Figure 5
Defective mast-cell maturation and anaphylaxis by DP1 deficiency. (a) Quantification of ear edema in PCA in Ptgdr+/+ (+/+) and Ptgdr−/− (−/−) mice with (IgE-Ag (+)) or without (IgE-Ag (−)) antigen challenge. (b) Counts of toluidine blue+ dermal mast cells in Ptgdr+/+ (+/+) and Ptgdr−/− (−/−) mice before and 2 min after IgE-Ag–mediated PCA (n = 6). Number of degranulated mast cells were evaluated by staining of skin sections from Ptgdr+/+ and Ptgdr−/−mice with toluidine blue, as in Figure 2g. (c) Transmission electron microscopy of ear mast cells in Ptgdr+/+ (+/+) and Ptgdr−/− (−/−) before (IgE-Ag (−)) and 2 min after (IgE-Ag (+)) antigen challenge. Scale bars, 2 μm. (d) Histamine levels in ears of Ptgdr+/+ and Ptgdr−/− mice (n = 10). (e) Quantification of ear edema in IgE-Ag–dependent PCA in KitW-sh/W-sh (Wsh) mice with or without reconstitution with Ptgdr+/+ (+/+) or Ptgdr−/− (−/−) BMMCs. (f,g) Expression of Ptgdr in Pla2g3+/+ and Pla2g3−/− BMMCs before and on day 2 of coculture (n = 6; f) and in the ear of Pla2g3+/+ and Pla2g3−/− mice (g). (h,i) Expression of Hdc relative to Gapdh in Ptgdr+/+ and Ptgdr−/− BMMCs (n = 6; h) or in wild-type BMMCs with or without BW A868C (n = 7; i) before and on day 2 of coculture. (j,k) Expression of Hdc relative to Gapdh in Pla2g3+/+ and Pla2g3−/− BMMCs before and on day 2 of coculture with or without BW 245C (n = 6; j) or forskolin (n = 6; k). Data are compiled from two (b,d,f–k) or three (a,e) experiments (mean ± s.e.m., *P < 0.05; **P < 0.01; NS, not significant). Images in c are representative of two experiments.
Figure 6
Figure 6
Defective mast-cell maturation and anaphylaxis by L-PGDS deficiency. (a) Expression of Ptgds and Ptgds2 relative to Gapdh in wild-type BMMCs and Swiss 3T3 fibroblasts. (b,c) Quantification of ear edema in PCA in Ptgds−/− (b), Ptgds2−/− (c) mice (−/−) and littermate wild-type (+/+) mice with (IgE-Ag (+)) or without (IgE-Ag (−)) antigen challenge. (d) Dermal mast-cell counts in Ptgds+/+ and Ptgds−/− mice before and 2 min after IgE-Ag–mediated PCA (n = 6). Number of degranulated mast cells were evaluated by staining of skin sections with toluidine blue, as in Figure 2g. (e) Transmission electron microscopy of Ptgds+/+ (+/+) and Ptgds−/− (−/−) ear mast cells before (IgE-Ag (−)) and 2 min after (IgE-Ag (+)) antigen challenge. Scale bars, 2 μm. (f) Histamine levels in ears of Ptgds+/+ and Ptgds−/− mice (n = 10). (g) Ptgds expression in Swiss 3T3 fibroblasts after Ptgds or scrambled siRNA treatment and Hdc expression in wild-type BMMCs before and on day 2 of coculture with siRNA-treated fibroblasts (n = 7). (h,i) PGD2 generation (h) and Hdc expression (i) before and on day 1 of coculture of Pla2g3+/+ or Pla2g3−/− BMMCs with Swiss 3T3 fibroblasts with or without AT-56 (n = 6). (j) Hdc expression in wild-type BMMCs before and on day 4 of coculture with Ptgds+/+ (+/+) or Ptgds−/− (−/−) skin fibroblasts (n = 6). (k,l) PGD2 levels (n = 10; k) and Ptgds and Ptgds2 expression (l) in the ear skin of Pla2g3+/+ and Pla2g3−/− mice. Data are compiled from two (a,d,f,hl) or three (b,c,g) experiments (mean ± s.e.m., *P < 0.05; **P < 0.01; NS, not significant). Images in e are representative of two experiments.
Figure 7
Figure 7
The PLA2G3–L-PGDS–DP1 axis facilitates maturation of human mast cells. (a) Immunohistochemistry analysis of human skin sections (atopic dermatitis) with anti-PLA2G3 (α-PLA2G3) or a preimmune antibody, followed by counterstaining with toluidine blue (scale bars, 50 μm). Blue and red arrows indicate resting and degranulated mast cells, respectively. Boxed areas are magnified below (scale bars, 5 μm). (b) Expression of PLA2G3 relative to HRPT1 in primary mast cells and fibroblasts obtained from human skin and lung (n = 3). (c) Expression of HDC relative to KIT in human lung mast cells before or on day 4 of coculture with human lung fibroblasts in the presence or absence of 5 μg/ml anti-PLA2G3, 10 μM AT-56 or 1 μM BW A868C (n = 4). Data are from one experiment (b,c; mean ± s.e.m., *P < 0.05; **P < 0.01). Images in a are representative of two experiments.

Comment in

Similar articles

Cited by

References

    1. Galli SJ, Tsai M. IgE and mast cells in allergic disease. Nat Med. 2012;18:693–704. - PMC - PubMed
    1. Gurish MF, Austen KF. Developmental origin and functional specialization of mast cell subsets. Immunity. 2012;37:25–33. - PubMed
    1. Allakhverdi Z, Smith DE, Comeau MR, Delespesse G. Cutting edge: The ST2 ligand IL-33 potently activates and drives maturation of human mast cells. J Immunol. 2007;179:2051–2054. - PubMed
    1. Matsuda H, et al. Nerve growth factor induces development of connective tissue-type mast cells in vitro from murine bone marrow cells. J Exp Med. 1991;174:7–14. - PMC - PubMed
    1. Abonia JP, et al. Constitutive homing of mast cell progenitors to the intestine depends on autologous expression of the chemokine receptor CXCR2. Blood. 2005;105:4308–4313. - PMC - PubMed

Publication types

MeSH terms

Associated data