

Gene expression is highly correlated on the chromosome level in urinary bladder cancer
- PMID: 23624844
- PMCID: PMC3680534
- DOI: 10.4161/cc.24673
Gene expression is highly correlated on the chromosome level in urinary bladder cancer
Abstract
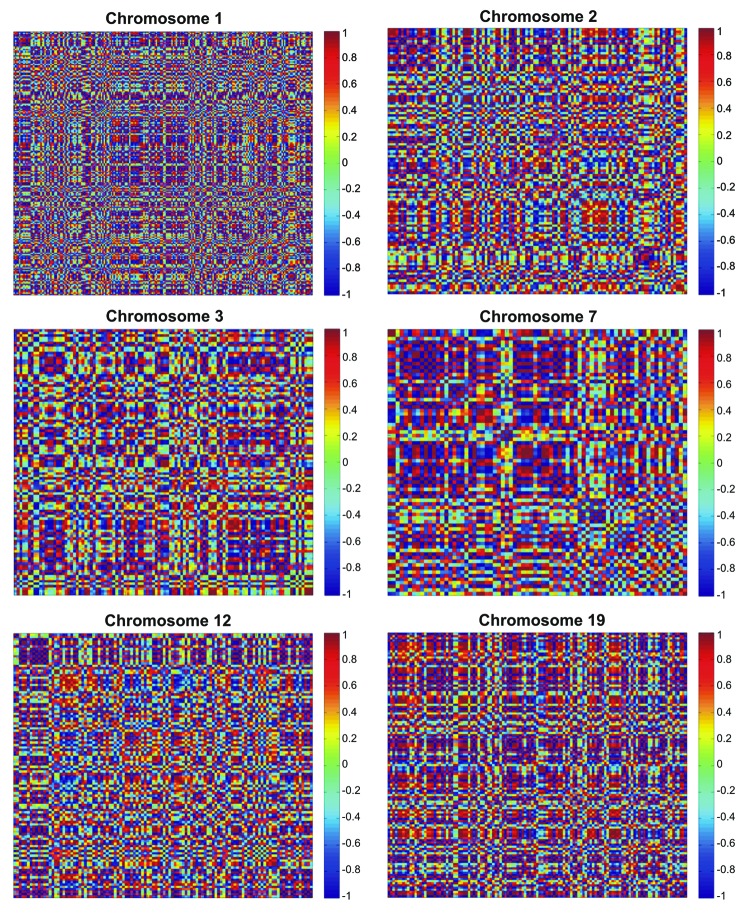
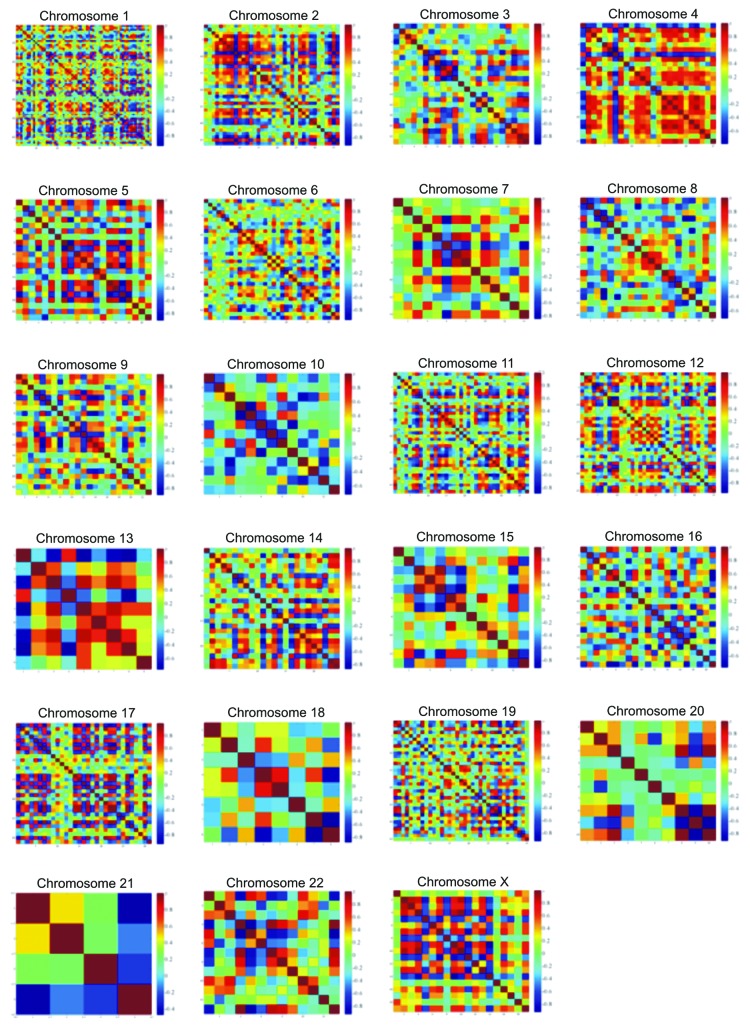
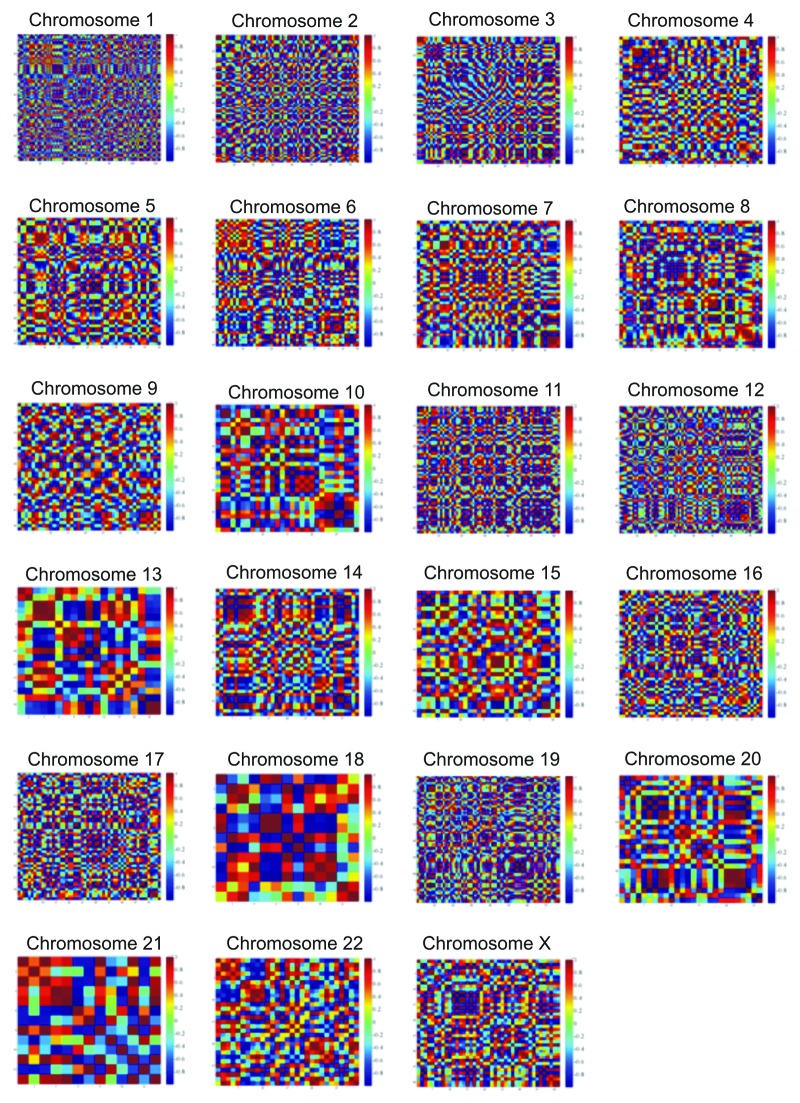
Objective: Chromosome correlation maps display correlations between gene expression patterns on the same chromosome. Our goal was to map the genes on chromosome regions and to identify correlations through their location on chromosome regions.
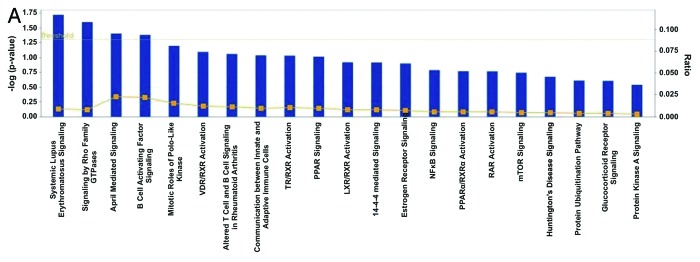
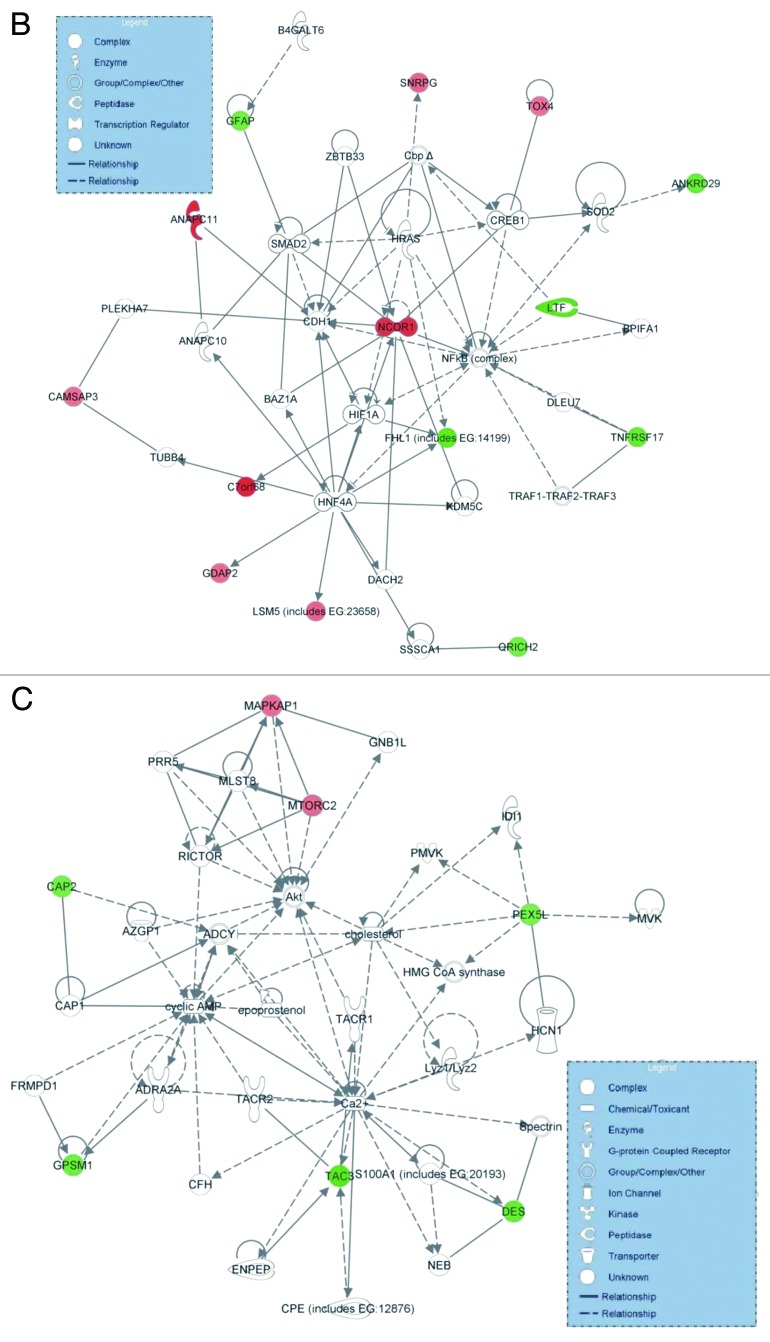
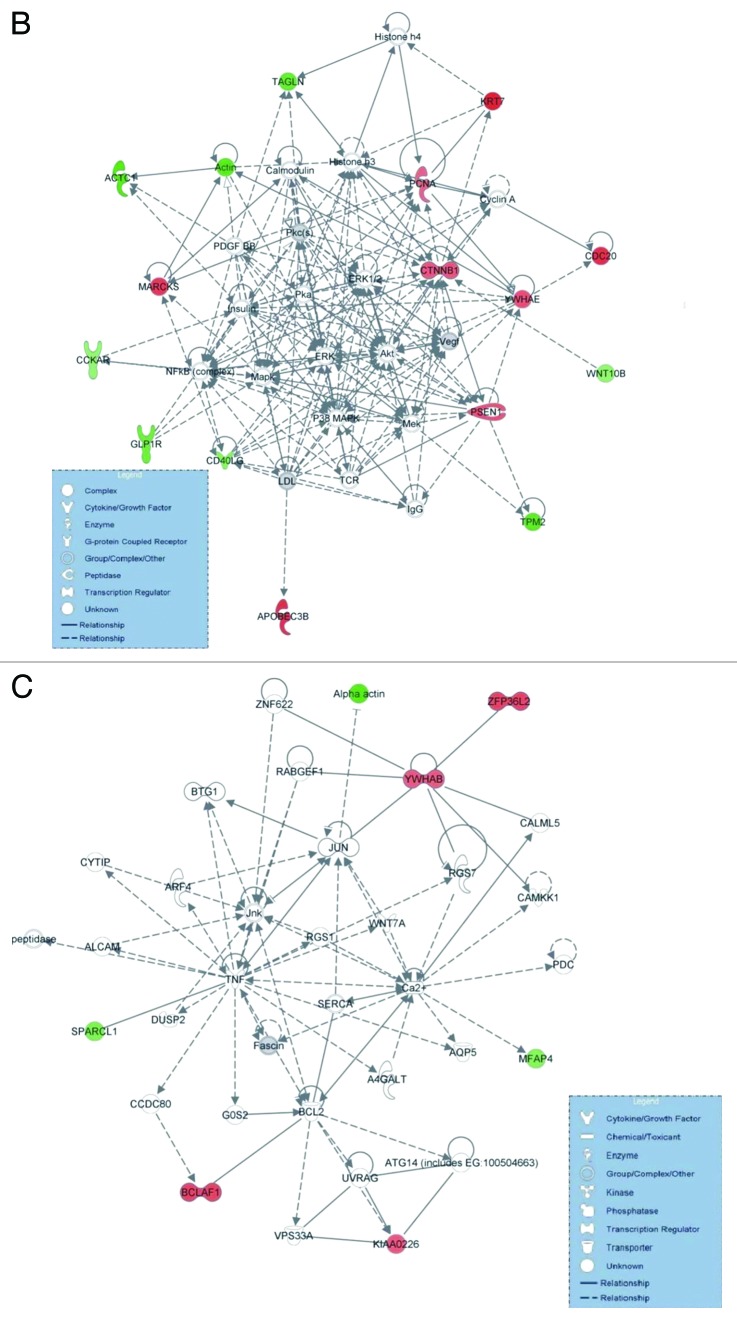
Materials and methods: Following microarray analysis we used Ingenuity Pathway Analysis (IPA) to construct gene networks of the co-deregulated genes in bladder cancer. Chromosome mapping, mathematical modeling and data simulations were performed using the WebGestalt and Matlab(®) softwares.
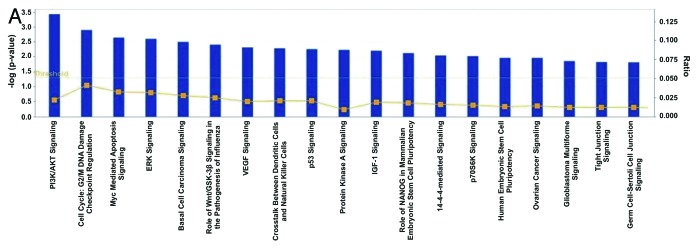
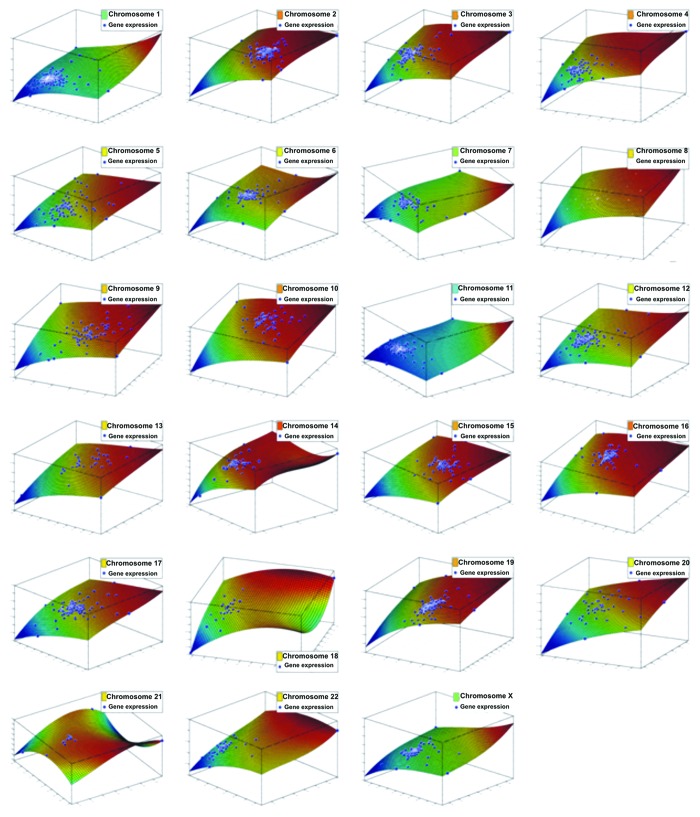
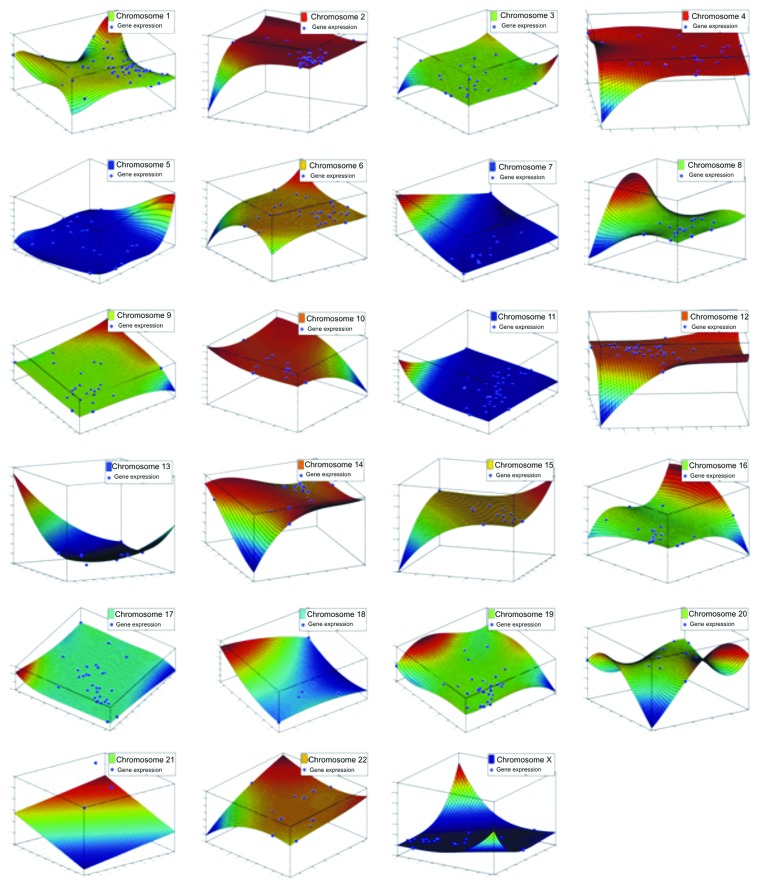
Results: The top deregulated molecules among 129 bladder cancer samples were implicated in the PI3K/AKT signaling, cell cycle, Myc-mediated apoptosis signaling and ERK5 signaling pathways. Their most prominent molecular and cellular functions were related to cell cycle, cell death, gene expression, molecular transport and cellular growth and proliferation. Chromosome correlation maps allowed us to detect significantly co-expressed genes along the chromosomes. We identified strong correlations among tumors of Tα-grade 1, as well as for those of Tα-grade 2, in chromosomes 1, 2, 3, 7, 12 and 19. Chromosomal domains of gene co-expression were revealed for the normal tissues, as well. The expression data were further simulated, exhibiting an excellent fit (0.7 < R(2) < 0.9). The simulations revealed that along the different samples, genes on same chromosomes are expressed in a similar manner.
Conclusions: Gene expression is highly correlated on the chromosome level. Chromosome correlation maps of gene expression signatures can provide further information on gene regulatory mechanisms. Gene expression data can be simulated using polynomial functions.
Keywords: bladder cancer; chromosome correlation maps; data simulations; mathematical modeling; molecular networks.
Figures
Similar articles
-
Expression of genes related to apoptosis, cell cycle and signaling pathways are independent of TP53 status in urinary bladder cancer cells.Mol Biol Rep. 2011 Aug;38(6):4159-70. doi: 10.1007/s11033-010-0536-x. Epub 2010 Nov 30. Mol Biol Rep. 2011. PMID: 21116856
-
Comprehensive analysis of differentially expressed genes associated with PLK1 in bladder cancer.BMC Cancer. 2017 Dec 16;17(1):861. doi: 10.1186/s12885-017-3884-2. BMC Cancer. 2017. PMID: 29246203 Free PMC article.
-
Extracellular matrix-related genes play an important role in the progression of NMIBC to MIBC: a bioinformatics analysis study.Biosci Rep. 2020 May 29;40(5):BSR20194192. doi: 10.1042/BSR20194192. Biosci Rep. 2020. PMID: 32391563 Free PMC article.
-
Spotlight on differentially expressed genes in urinary bladder cancer.PLoS One. 2011 Apr 5;6(4):e18255. doi: 10.1371/journal.pone.0018255. PLoS One. 2011. PMID: 21483670 Free PMC article.
-
Genetic and molecular markers of urothelial premalignancy and malignancy.Scand J Urol Nephrol Suppl. 2000;(205):82-93. doi: 10.1080/003655900750169338. Scand J Urol Nephrol Suppl. 2000. PMID: 11144907 Review.
Cited by
-
Diagnostic and prognostic potential clustered miRNAs in bladder cancer.3 Biotech. 2022 Aug;12(8):173. doi: 10.1007/s13205-022-03225-z. Epub 2022 Jul 13. 3 Biotech. 2022. PMID: 35845108 Free PMC article.
-
Knockdown of fibrous sheath interacting protein 1 expression reduces bladder urothelial carcinoma cell proliferation and induces apoptosis via inhibition of the PI3K/AKT pathway.Onco Targets Ther. 2018 Apr 5;11:1961-1971. doi: 10.2147/OTT.S158275. eCollection 2018. Onco Targets Ther. 2018. Retraction in: Onco Targets Ther. 2022 Jan 20;15:85-86. doi: 10.2147/OTT.S358438. PMID: 29670371 Free PMC article. Retracted.
-
Predicting the Survival Time for Bladder Cancer Using an Additive Hazards Model in Microarray Data.Iran J Public Health. 2016 Feb;45(2):239-48. Iran J Public Health. 2016. PMID: 27114989 Free PMC article.
-
Fractal dimensions of in vitro tumor cell proliferation.J Oncol. 2015;2015:698760. doi: 10.1155/2015/698760. Epub 2015 Mar 25. J Oncol. 2015. PMID: 25883653 Free PMC article.
References
MeSH terms
LinkOut - more resources
Full Text Sources
Other Literature Sources
Medical
Molecular Biology Databases
Miscellaneous