Review
. 2013 Jan-Feb;5(1):1-15.
doi: 10.4161/isl.24166.

Ion channels and regulation of insulin secretion in human β-cells: a computational systems analysis

Affiliations
Review

Ion channels and regulation of insulin secretion in human β-cells: a computational systems analysis

Leonid E Fridlyand et al. Islets. 2013 Jan-Feb.

Abstract

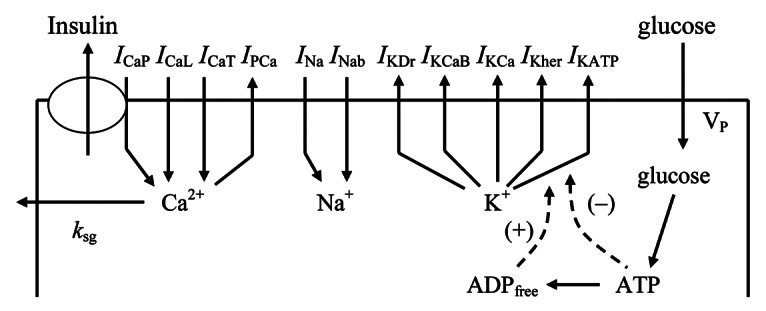
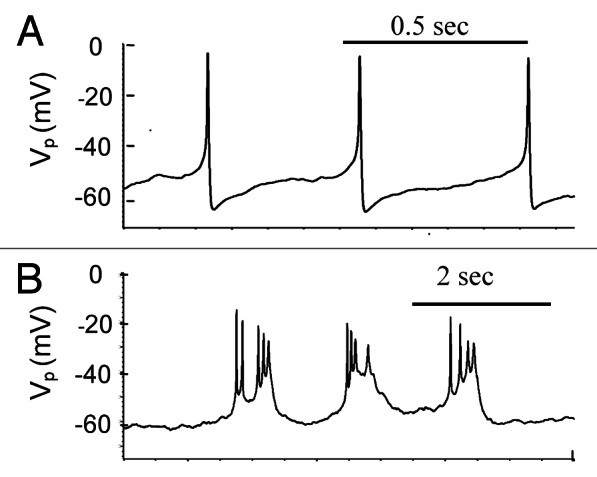
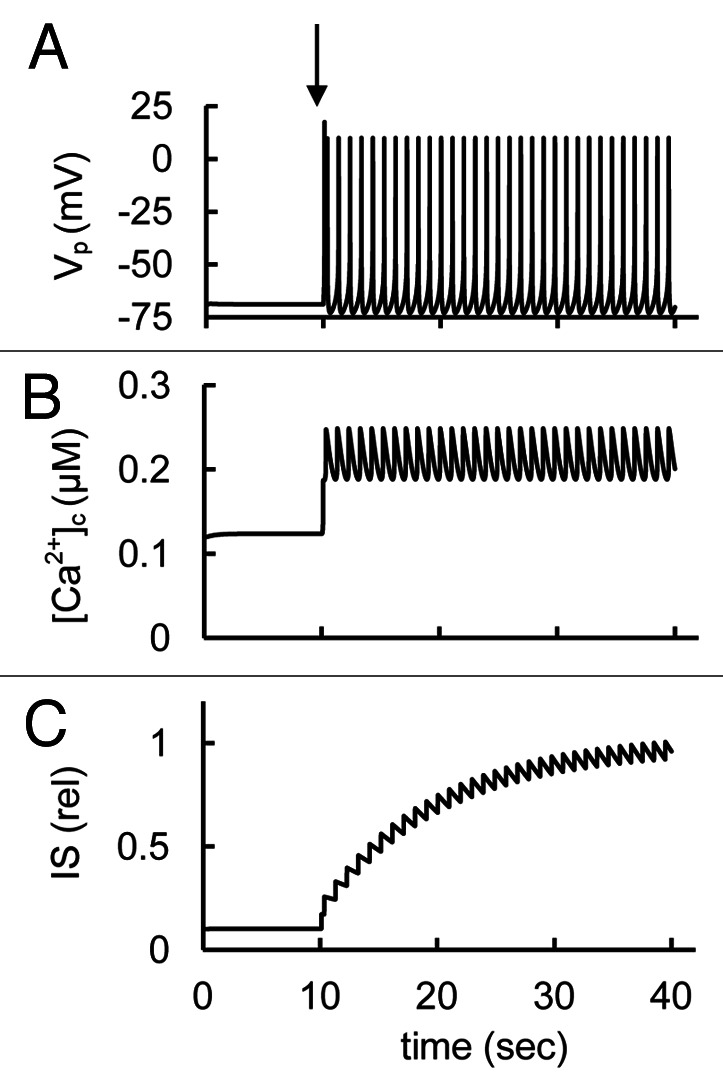
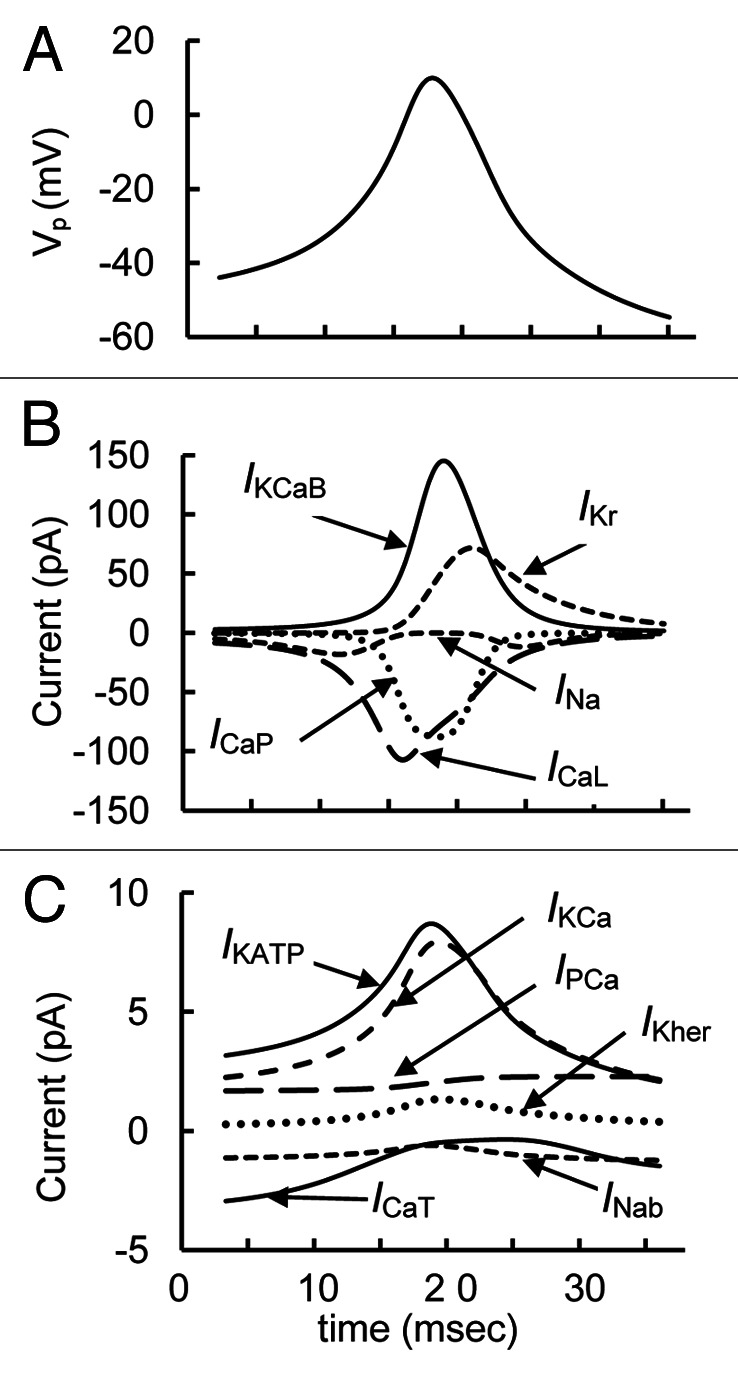
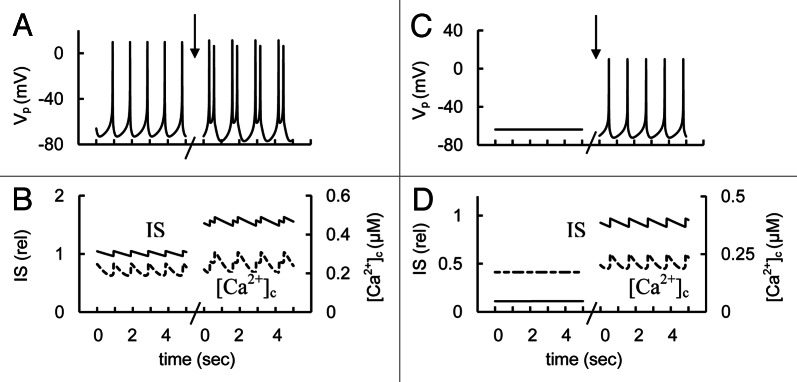
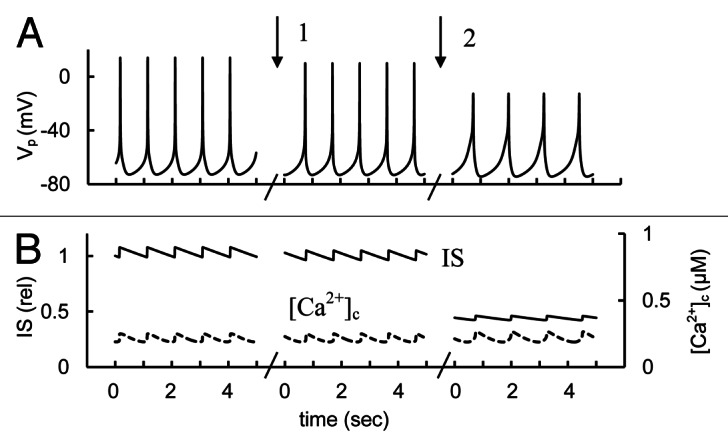
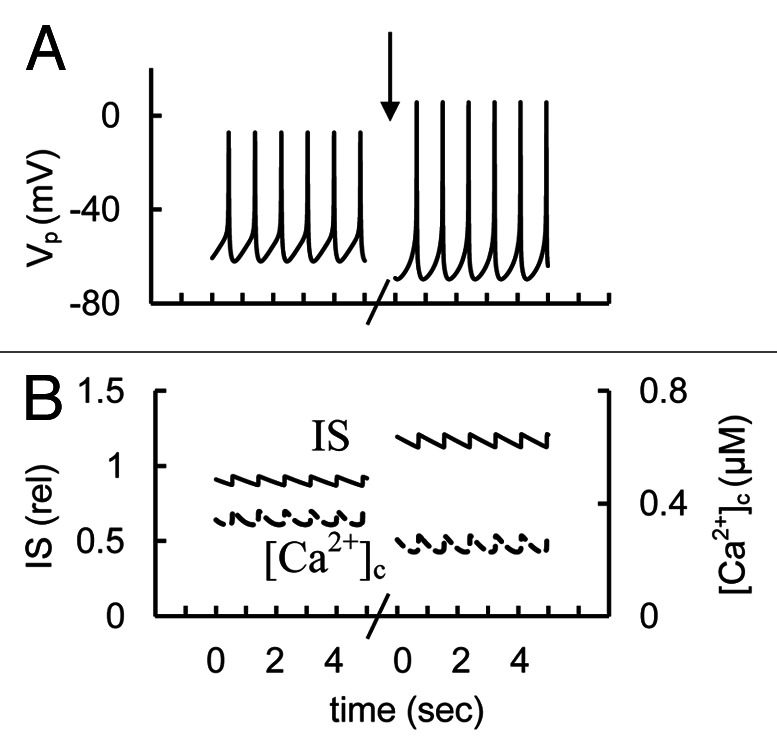
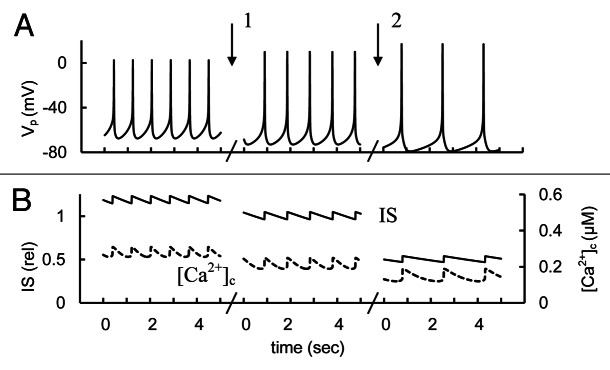
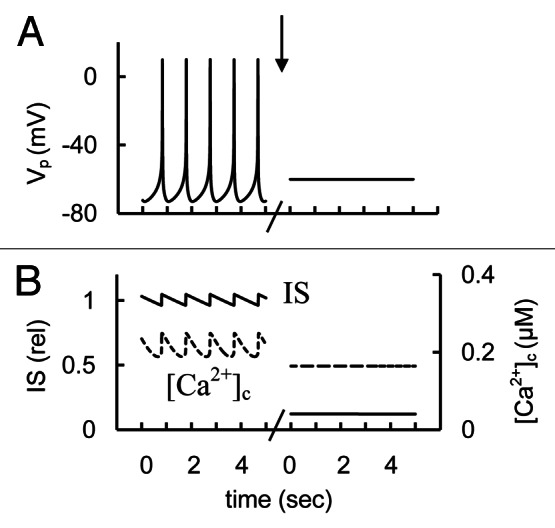
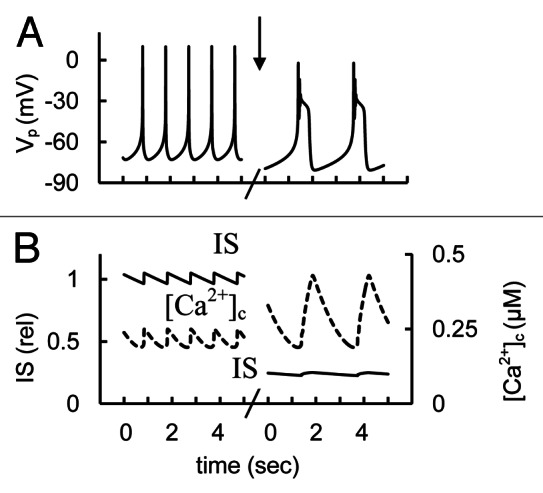
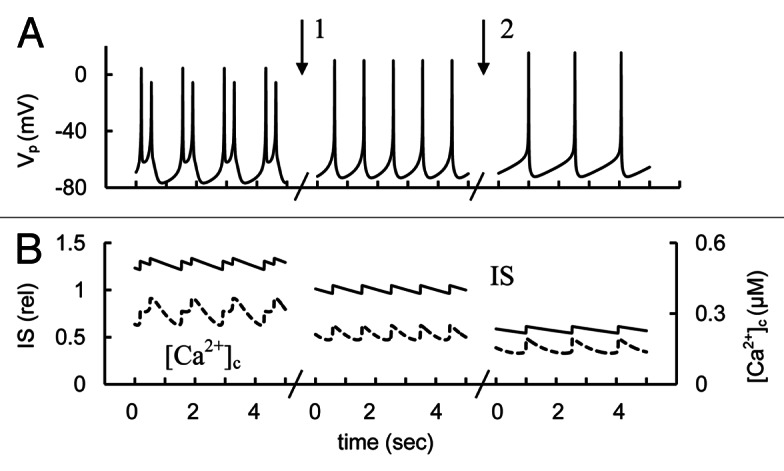
In mammals an increase in glucose leads to block of ATP dependent potassium channels in pancreatic β cells leading to membrane depolarization. This leads to the repetitive firing of action potentials that increases calcium influx and triggers insulin granule exocytosis. Several important differences between species in this process suggest that a dedicated human-oriented approach is advantageous as extrapolating from rodent data may be misleading in several respects. We examined depolarization-induced spike activity in pancreatic human islet-attached β-cells employing whole-cell patch-clamp methods. We also reviewed the literature concerning regulation of insulin secretion by channel activity and constructed a data-based computer model of human β cell function. The model couples the Hodgkin-Huxley-type ionic equations to the equations describing intracellular Ca²⁺ homeostasis and insulin release. On the basis of this model we employed computational simulations to better understand the behavior of action potentials, calcium handling and insulin secretion in human β cells under a wide range of experimental conditions. This computational system approach provides a framework to analyze the mechanisms of human β cell insulin secretion.

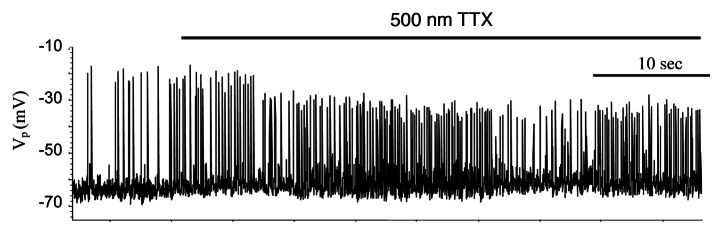
Keywords: diabetes; electrophysiology; glucose; mathematical model; membrane potential; ranolazine; tetrodotoxin.


Figures

None
Figure 1. Schematic diagram of the ionic current, Ca2+ fluxes and exocytosis in human β-cell. Transmembrane currents are: ICaP is the voltage-gated P-type Ca2+ current, that is also responsible for insulin release (see text), ICaL is the voltage-gated L-type Ca2+ current, ICaT is the voltage-gated T-type Ca2+ current; IPCa, plasma membrane Ca2+ pump current; INa, voltage-gated Na+ current; INab, Na+ background current IKDr, delayed rectifier K+ current; IKCaB, Ca2+ and high voltage-activated K+ (BK channel) current; IKCa, Ca2+ activated K+ (SK channel) current; IKher is the human-ERG K+ channel current and IKATP, ATP-sensitive K+ channels current. Calcium enters the β-cells primarily through voltage-activated Ca2+ channels by diffusion along an inwardly directed electrochemical gradient. At the plasma membrane two processes are involved in transporting Ca2+ out of the cell; a Ca2+ pump and removal of Ca2+ sequestrated in insulin granules by exocytosis (coefficient ksq).
None
Figure 2. Electrical activity in human islets during treatment of 14 mM glucose. Examples of representative action potentials (AP). (A) Simple spikes. (B) Complex spikes. Experiments were performed as described in “Materials and Methods.”
None
Figure 3. Modeling of spontaneous glucose-stimulated spikes, the changes of intracellular Ca2+ concentration and insulin secretion. (A) Action potentials (Vp); (B) Free cytoplasmic Ca2+ concentration ([Ca2+]c); (C) relative insulin secretion (IS). Glucose-induced spikes were simulated at a step decrease of the free ADP concentration at the arrow from a high to an intermediate value (from [ADPf]c = 100 µM to 15 µM; all other parameter were taken from the basal set of parameters (Tables S1 and S2). Corresponding changes in [Ca2+]c and IS were simulated using Eqs. Two and 7 in Appendix 1 in Supplemental Materials.
None
Figure 4. Detailed simulated curves of parameters during a single simple spike from Figure 3. (A) Action potential (Vp); (B) Principal currents for AP (ICaL, ICaP, IKCaB, IKDr, and INa) are represented for one characteristic spike. (C) Small currents (ICaT, IPCa, INab, IKCa, IKher and IKATP) are also represented for this interval.
None
Figure 5. Simulated AP firing, [Ca2+]c and IS transients in response to activation or block of KATP channel conductance. (A) AP firing (Vp); (B) [Ca2+]c (– – –) and relative IS (——) during persistent spike activity (after transient changes). For simulation of KATP channel activation the maximal conductance (gmKATP, Eq. A41, Appendix 2 in Supplemental Material) was initially increased to 65 nS. Than gmKATP was decreased from 65 nS to 45 nS (basal level from Table S2) at arrow 1. For simulation of KATP channel block the gmKATP was decreased from 45 nS to 4 nS at arrow 2. Glucose induced APs were simulated as in Figure 3 up to the point of persistent spike activity. Several intervals in five second are represented for each case.
None
Figure 6. Simulation of K+ BK channel blocker application. (A) AP firing (Vp); (B) [Ca2+]c (– – –) and relative IS (——). The maximal conductance (gmkcab,Eq. A28, Appendix 2in Supplemental Material) was decreased from 25 nS (basal level from Table S2) to 0 nS at arrow. Glucose induced AP firing was simulated as in Figure 3.
None
Figure 7. Modeling of glucose induced action potential firing, [Ca2+]c and IS during a simulation of rapid delayed rectified voltage-gated K+ channels blocking. (A) AP firing (Vp); (B) [Ca2+]c (– – –) and relative IS (——). For simulation of KDr channel blocking the maximal conductance (gmKr, Eq. A24, Appendix 2 in Supplemental Material) was decreased from 18 nS (basal level) to 0 nS at arrow. Glucose induced AP firing was simulated up to persistent spike activity as in Figure 3. Five second intervals are represented.
None
Figure 8. Simulation of changes of human ERG channel conductance. (A) AP firing (Vp); (B) [Ca2+]c (– – –) and relative IS (——). For simulation of HERG channel activation the maximal conductance (gmKhe, Eq. A34, Appendix 2 in Supplemental Material) was initially increased up to 1,000 nS. Then gmKhe was decreased from 1000 nS to 200 nS (basal level from Table S2) at arrow 1. For simulation of block of HERG channel the gmKhe was decreased from 200 pS to 20 nS at arrow 2. Glucose induced persistent AP firing was simulated as in Figure 3.
None
Figure 9. Simulated response to block of KCa channels. (A and C) AP firing (Vp). (B and D). [Ca2+]c (– – –) and relative IS (——). Effect of KCa blockers was simulated by reducing of the maximum conductance for KCa channels (gmKCa, Eq. A39, Appendix 2 in Supplemental Material) that was decreased from 150 pS (basal set from Table S2) to 20 pS at arrows. Other coefficients were as in Figure 3. (1). A and B represent the simulation at high glucose level as in Figure 3. C and D are the simulation at decreased glucose level ([ADP]f = 30 µM).
None
Figure 10. Effect of Na+ channel blocker tetrodotoxin (TTX) on spikes behavior in isolated human islets at 14 mM glucose. Representative examples of spikes. Experiments were performed as described in Sec. Two “Materials and methods.”
None
Figure 11. Simulated glucose induced spikes behavior, [Ca2+]c and IS changes at Na+ channel activation or blocking. (A) AP firing (Vp); (B) [Ca2+]c (– – –) and relative IS (——). For simulation of Na+ channel activation the maximal conductance (gmNa, Eq. A1, Appendix 2 in Supplemental Material) was initially increased to 20 nS, then gmNa was decreased from 20 nS to 10 nS (basal level from Table S2) at arrow 1. For simulation of block of Na+ channels the gmNa was decreased from 10 nS to 0.5 nS at arrow 2. Glucose induced APs were simulated as in Figure 3 up to persistent AP firing. Five second intervals are represented for every case.
None
Figure 12. Simulated glucose induced AP firing, [Ca2+]c and relative IS at persistent (late) Na+ current changes. (A) AP firing (Vp); (B) [Ca2+]c (– – –) and relative IS (——). Initially the coefficient (kNar, Eq. A1, Appendix 2 in Supplemental Material) responsible for persistent Na+ current was 0.002 (basal level for this coefficient is zero in Table S2). For simulation of block of the persistent (late) Na+ currant this coefficient was decreased to 0.0006 at arrow. Glucose induced AP firing was simulated as in Figure 3. Five second intervals are represented.
None
Figure 13. Simulated glucose induced AP firing, [Ca2+]c and relative IS at Na+ background current changes. (A) AP firing (Vp); (B) [Ca2+]c (– – –) and relative IS (——). For simulation of Na+ background current activation the maximal conductance (gbNa, Eq. A45, Appendix 2 in Supplemental Material) was initially increased up to 20 pS. Than gbNa was decreased from 20 pS to 10 pS (basal level from Table S2) at arrow 1. For simulation of block of Na+ background current the gbNa was decreased from 10 pS to 1 pS at arrow 2. Glucose induced persistent AP firing was simulated as in Figure 3. Five second intervals are represented for every case.
None
Figure 14. Simulated glucose induced AP spikes, [Ca2+]c and IS changes after simulation of L-type Ca2+ channel blockers application. (A) AP firing (Vp); (B) [Ca2+]c (– – –) and relative IS (——). The maximal conductance (gmCaL, Eq. A6, Appendix 2 in Supplemental Material) was decreased from 2.7 nS (basal level from Table S2) to 0.2 nS at arrow. Glucose induced persistent AP firing was simulated as in Figure 3. Five second intervals are represented.
None
Figure 15. Simulated glucose induced AP spikes, [Ca2+]c and IS changes after of P-type Ca2+ channel blockers application. (A) AP firing (Vp); (B) [Ca2+]c (– – –) and relative IS (——). The maximal conductance (gmCaP, Eq. A14, Appendix 2) was decreased from 1.2 nS (basal level from Table S2) to 0.2 nS at arrow. Glucose induced AP firing was simulated as in Figure 3. Five second intervals are represented.
None
Figure 16. Simulated glucose induced spikes behavior, [Ca2+]c and IS changes at T-type Ca2+ channel activation or blocking. (A) AP firing (Vp); (B) [Ca2+]c (– – –) and relative IS (——). For simulation of T-type Ca2+ channel activation the maximal conductance (gmCaT, Eq. A19, Appendix 2 in Supplemental Material) was initially increased up to 500 pS. Than gmCaT was decreased from 500 pS to 250 pS (basal level from Table S2) at arrow 1. For simulation of block of T-type Ca2+ channel the gmCaT was decreased from 200 pS to 50 nS at arrow 2. Glucose induced persistent AP firing was simulated as in Figure 3.

Similar articles

Cited by

References

    1. Jacobson DA, Philipson LH. Ion Channels and Insulin secretion. In: Seino S, Bell G, eds. Pancreatic Beta Cell in Health and Desease. Japan: Springer, 2008:91- 110.
    1. Rorsman P, Braun M, Zhang Q. Regulation of calcium in pancreatic α- and β-cells in health and disease. Cell Calcium. 2012;51:300–8. doi: 10.1016/j.ceca.2011.11.006. - DOI - PMC - PubMed
    1. Drews G, Krippeit-Drews P, Düfer M. Electrophysiology of islet cells. Adv Exp Med Biol. 2010;654:115–63. doi: 10.1007/978-90-481-3271-3_7. - DOI - PubMed
    1. Ashcroft FM, Rorsman P. Electrophysiology of the pancreatic beta-cell. Prog Biophys Mol Biol. 1989;54:87–143. doi: 10.1016/0079-6107(89)90013-8. - DOI - PubMed
    1. Gilon P, Henquin JC. Mechanisms and physiological significance of the cholinergic control of pancreatic beta-cell function. Endocr Rev. 2001;22:565–604. doi: 10.1210/er.22.5.565. - DOI - PubMed

Publication types

LinkOut - more resources