. 2014 Apr 3;33(14):1850-61.
doi: 10.1038/onc.2013.131. Epub 2013 Apr 29.

MEK inhibition affects STAT3 signaling and invasion in human melanoma cell lines

Affiliations

MEK inhibition affects STAT3 signaling and invasion in human melanoma cell lines

A Vultur et al. Oncogene. .

Abstract

Elevated activity of the mitogen-activated protein kinase (MAPK) signaling cascade is found in the majority of human melanomas and is known to regulate proliferation, survival and invasion. Current targeted therapies focus on decreasing the activity of this pathway; however, we do not fully understand how these therapies impact tumor biology, especially given that melanoma is a heterogeneous disease. Using a three-dimensional (3D), collagen-embedded spheroid melanoma model, we observed that MEK and BRAF inhibitors can increase the invasive potential of ∼20% of human melanoma cell lines. The invasive cell lines displayed increased receptor tyrosine kinase (RTK) activity and activation of the Src/FAK/signal transducers and activators of transcription-3 (STAT3) signaling axis, also associated with increased cell-to-cell adhesion and cadherin engagement following MEK inhibition. Targeting various RTKs, Src, FAK and STAT3 with small molecule inhibitors in combination with a MEK inhibitor prevented the invasive phenotype, but only STAT3 inhibition caused cell death in the 3D context. We further show that STAT3 signaling is induced in BRAF-inhibitor-resistant cells. Our findings suggest that MEK and BRAF inhibitors can induce STAT3 signaling, causing potential adverse effects such as increased invasion. We also provide the rationale for the combined targeting of the MAPK pathway along with inhibitors of RTKs, SRC or STAT3 to counteract STAT3-mediated resistance phenotypes.


Conflict of interest statement

Conflict of Interest

The authors declare no conflict of interest.

Figures
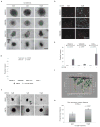
Figure 1
Figure 1. MEK inhibition causes increased migration/invasion in a cohort of melanoma cell lines
A) 3D melanoma spheroids growing in a collagen matrix and treated with increasing doses of the MEK inhibitor UO126 for 72 h show invasive edges. Sample images are shown. Scale bar represents 200 microns for all panels except 1205Lu (600 microns). B) Quantitation of melanoma cell motility from spheroid edge in cell lines grown as spheroids as shown for (A). Values indicate the relative spheroid invasion area compared to the vehicle control-treated spheroids. The invasion observed in the treated spheroids was significantly higher than in the untreated spheroids (p=0.0095), controlling for cell line (p<0.0001). Experiments were conducted in triplicate. C) The early melanoma stage cell lines WM35 and WM793 are sensitive to UO126 and display reduced growth and invasion upon a 72 h treatment. Spheroid size differences are delineated in red, based on circumference of the untreated samples. Scale bar represents 600 microns. D) Transwell invasion assay showing DAPI staining of single cells invading through a collagen-coated semi-porous membrane in the presence of UO126 (10μM). Cells were allowed to invade for 72 h and representative images are shown. Scale bar represents 300 microns. E) Graph showing relative invasion for transwell invasion experiments as conducted in (D). Experiments were conducted in triplicate; (WM3918, p=0.010; WM983B, p=0.999; 1205Lu, p=0.010). F) Computer generated 3D model of a skin reconstruct section depicting invading 1205Lu melanoma cells (green). The model is based on 2-photon images and allows a 3D view of the invasion profile of GFP-tagged melanoma cells in a skin reconstruct, as well as the quantitation of the perpendicular distance traveled by individual 1205Lu cells from the basement membrane. Multiple skin reconstruct sections were imaged, recreated in 3D, and quantitated based on this model and results are summarized in (G). G) Histogram summarizing the average distance travelled by invasive 1205Lu cells (in microns) in skin reconstructs exposed to vehicle control or UO126 (10uM). The perpendicular distance was measured over three different sections per condition, tracking the 5 most invasive cells per section using the 3D modeling system shown in (F). This distance was significantly higher for MEK-inhibitor treated cells than for untreated cells (p<0.0001). Error bars represent standard errors.
Figure 2
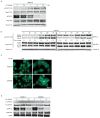
Figure 2. MEK inhibition causes RTK activation and engages the Src/FAK/STAT3 signaling axis
A) WM793 and WM3818 cells were treated with AZD6244 (10 μM) or DMSO vehicle control for 72h. Whole-cell lysates were incubated on RTK antibody arrays where each RTK antibody is spotted in duplicate. Differentially expressed RTKs are listed and indicated by a number. B) Western blot analysis examining phosphorylated and total levels of IGFR and PDGFR in melanoma cell lines that are non-invasive (WM793) or invasive (WM3918, 1205Lu) following MEK inhibition. Cells were treated with UO126 (10 μM) for 72h before collection of immunolysates. Fold change in band intensity between untreated and treated samples is shown. Histone H3 is the loading control. C) Western blot analysis of UO126-treated WM983B and WM3918 immunolysates extracted from 2D (top) and 3D collagen-embedded cultures (bottom). Phosphorylated levels and total levels of Src, FAK, STAT3, MEK, and ERK are shown, as well as the HSP90 loading control. D) Immunofluorescence staining of phospho-FAK576/577 and phospho-STAT3Y705 (red) in control and UO126 (10μM) treated cells for 72 h. Cell nuclei are DAPI-stained (blue). Scale bar represents 50 microns. E) Western blot analysis of immunolysates from a melanoma cell line sensitive to UO126 (WM793). Phosphorylated levels and total levels of FAK, STAT3, ERK, and MEK are shown, as well as the Hsp90 loading control.
Figure 3
Figure 3. STAT3 activation correlates with decreased ERK activity and enhanced cadherin engagement
A) Dose-dependent activation of STAT3 (Y705 phosphorylation) and inhibition of ERK by UO126 using western blot analysis. Cells were treated for 72h before collection of immunolysates. B) Time-dependent activation of STAT3 upon treatment with UO126 (10μM). Fold change in band intensity between untreated and treated samples is shown for phosphorylated STAT3 and ERK. C) F-actin staining using AlexaFluor488 Phalloidin staining (green) of control or UO126 (10μM) treated cells for 72 h. Cell nuclei are DAPI-stained (blue). Scale bar represents 50 microns. D) Western blot analysis of E- and N-cadherin levels, as well as phosphorylated ERK, following 72 h treatment with increasing doses of UO126.
Figure 4
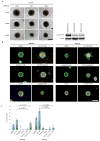
Figure 4. Targeting the STAT3 pathway can reverse the invasive phenotype induced by MEK inhibition
A) STAT3 knockdown cells were grown as spheroids, embedded in collagen and allowed to invade for 72 h in the presence of UO126 or vehicle control. Spheroid invasion differences are delineated in red and representative images are shown. Scale bar represents 300 microns. Experiments were conducted in triplicate. Right panel: STAT3 knockdown efficiency following melanoma cell infection with a lentiviral vector. B) UO126 (MEK inhibitor, 10μM), Dasatinib (SRC/RTK inhibitor, 1uM), and CPA-7 (STAT3 inhibitor, 10μM), were added to collagen-embedded spheroids for 72 h as single agents or combinations as indicated. Survival and invasion were monitored using a live/dead assay. Green fluorescence indicates metabolically active (live) cells, red fluorescence indicates membrane compromised (dead) cells. Experiments were conducted in triplicate and representative images are shown. Scale bar represents 600 microns. C) Graph depicting the invasion of melanoma cells using a transwell invasion assay following treatment with UO126 (MEK inhibitor, 10μM), Dasatinib (SRC/RTK inhibitor, 1uM), and CPA-7 (STAT3 inhibitor, 10μM), or combinations thereof. The ANOVA was significant for drug treatment but effects were different for the two cell lines. Specific comparisons show significant differences between UO126 and UO126+CPA-7 treated cells for both cell lines and a significant difference between UO126 and UO126+dasatinib for WM3918 only.
Figure 5
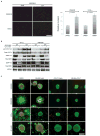
Figure 5. STAT3 phosphorylation is increased in BRAF-resistant melanoma cells
A) Transwell invasion assay showing DAPI staining of single melanoma cells invading through a collagen-coated semi-porous membrane in the presence of SB590885 (1μM). Cells were allowed to invade for 20 h. Representative photomicrographs are shown and scale bar represents 600 microns. A histogram shows the quantitation of melanoma cell invasion from transwell assays conducted in triplicate for two cell lines. Relative number of invasive cells in treated compared to the vehicle control-treated cells are shown. Relative invasion was significantly different for both cell lines (WM938B, p=0.016 and 1205Lu, p=0.004). Error bars depict standard errors. B) Western blot analysis of immunolysates from BRAFV600E mutant melanoma cell lines treated with SB590885 or vehicle control for 72 h. WT indicates the parental cell lines; BR indicates the BRAF inhibitor-resistant cell line counterpart. Phosphorylated and total levels of STAT3, MEK, and ERK are shown, as well as the HSP90 loading control. C) SB590885 (SB-885; 1μM) and CPA-7 (10μM) were added to collagen-embedded spheroids for 72 h. Spheroids were generated from BRAFV600E mutant melanoma cell lines (parental or BRAF inhibitor-resistant (BR)). Survival and invasion were monitored using a live/dead assay and representative images are shown. Green fluorescence indicates metabolically active (live) cells; red fluorescence indicates membrane compromised (dead) cells. Independent experiments were conducted in triplicate. Scale bar represents 600 microns.

Similar articles

Cited by

References

    1. Haass NK, Smalley KS, Herlyn M. The role of altered cell-cell communication in melanoma progression. J Mol Histol. 2004 Mar;35(3):309–18. - PubMed
    1. Fecher LA, Cummings SD, Keefe MJ, Alani RM. Toward a molecular classification of melanoma. J Clin Oncol. 2007 Apr 20;25(12):1606–20. - PubMed
    1. Bollag G, Hirth P, Tsai J, Zhang J, Ibrahim PN, Cho H, et al. Clinical efficacy of a RAF inhibitor needs broad target blockade in BRAF-mutant melanoma. Nature. 2010 Sep 7; - PMC - PubMed
    1. Lee JT, Li L, Brafford PA, van den Eijnden M, Halloran MB, Sproesser K, et al. PLX4032, a potent inhibitor of the B-Raf V600E oncogene, selectively inhibits V600E-positive melanomas. Pigment Cell Melanoma Res. 2010 Dec;23(6):820–7. - PMC - PubMed
    1. Chapman PB, Hauschild A, Robert C, Haanen JB, Ascierto P, Larkin J, et al. Improved survival with vemurafenib in melanoma with BRAF V600E mutation. N Engl J Med. 2011 Jun 30;364(26):2507–16. - PMC - PubMed