. 2013:3:1740.
doi: 10.1038/srep01740.

Quantitative transcriptomics using designed primer-based amplification

Affiliations

Quantitative transcriptomics using designed primer-based amplification

Vipul Bhargava et al. Sci Rep. 2013.

Abstract

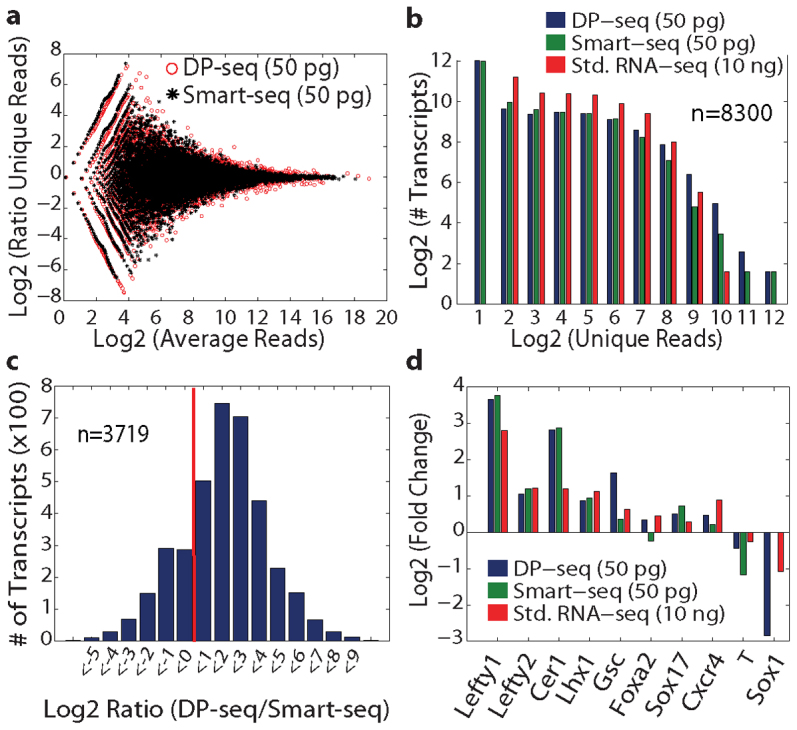
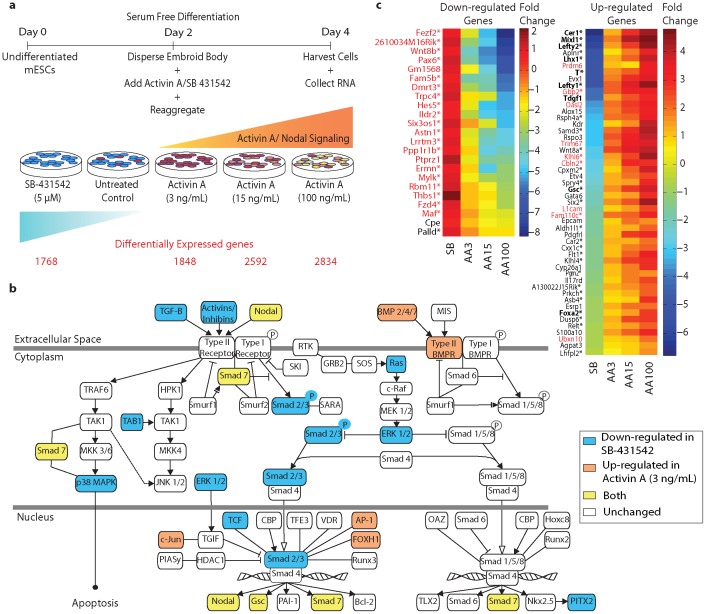
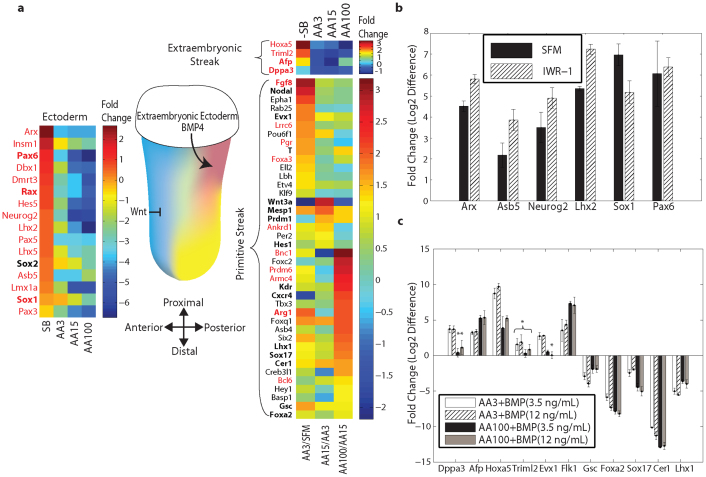
We developed a novel Designed Primer-based RNA-sequencing strategy (DP-seq) that uses a defined set of heptamer primers to amplify the majority of expressed transcripts from limiting amounts of mRNA, while preserving their relative abundance. Our strategy reproducibly yielded high levels of amplification from as low as 50 picograms of mRNA while offering a dynamic range of over five orders of magnitude in RNA concentrations. We also demonstrated the potential of DP-seq to selectively suppress the amplification of the highly expressing ribosomal transcripts by more than 70% in our sequencing library. Using lineage segregation in embryonic stem cell cultures as a model of early mammalian embryogenesis, DP-seq revealed novel sets of low abundant transcripts, some corresponding to the identity of cellular progeny before they arise, reflecting the specification of cell fate prior to actual germ layer segregation.


Figures

Figure 1
Figure 1. Schematic representation of sequencing library preparation using heptamer primers based amplification, DP-seq.
(a) Step 1: Primer selection was based on identifying potential primer-binding sites that were less likely to form secondary structures and resided upstream to the unique regions on the mouse transcriptome. Step 2: targeted cDNA amplification. A Standard cDNA library was prepared and the primers selected from Step 1 were annealed to the single stranded cDNA library and were extended and amplified as indicated. Step 3: Library preparation. Illumina paired end adaptors were ligated to the ends of the amplicon library and the correct orientation of adaptors were selected. The library was further amplified using Illumina's paired end adaptor primers and were size selected for synthesis-based sequencing. (b) Expression profiles of genes responding to graded activation of the Activin A/TGFβ signaling pathway in mouse embryoid bodies at day 4. Quantitative RT-PCR data was normalized with respect to untreated serum-free media controls. (c) The fidelity of amplification of the cDNA library using heptamer primers. Fold changes observed in 11 genes (from part (b), Afp and Cer1) across different dosages of Activin A showed perfect agreement with quantitative RT-PCR performed on cDNA (R2 = 0.94; n = 45). (d) Distribution of reads on the mouse genome.
Figure 2
Figure 2. Performance of DP-seq.
(a) Comparison of two Activin A 15 ng/ml dosage replicates (R2 = 0.96). (b) Six in vitro synthesized transcripts derived from the yeast POT1 promoter with a length of 180 bp were added to untreated control cDNA at varying concentrations spanning six orders of magnitude. The reads obtained from the transcripts revealed a fold change of up to 105 (R2 = 0.99) in comparison to the lowest abundant transcript. (c) Sequencing libraries constructed from serial dilutions of mRNA exhibited high correlations within the technical replicates. Libraries constructed from at least 50 pg of mRNA showed high correlations (R2) in global expression measurements with the libraries made from 10 ng of mRNA. (d) Suppression of the ribosomal transcripts representation in the sequencing library generated from three different primer sets. The global transcriptome coverage remained high for all primer sets.
Figure 3
Figure 3. Comparison of DP-seq with Smart-seq on Activin A treated samples (AA3 and AA100).
(a) MA plot of technical replicates obtained from AA100 sample showed similar technical noise in the two methods. (b) Distribution of unique reads for the low expressed transcripts (RPKM < 3 in Std. RNA-seq library prepared from AA100 sample) obtained in the three methods. The majority of the low expressed transcripts did not show expression in the libraries constructed from 50 pg of mRNA in DP-seq and Smart-seq. (c) A length bias in Smart-seq resulted in higher reads for the long cDNA species (> 4 Kb) in the DP-seq libraries. (d) Comparable fold changes were observed for the known lineage markers in the three methods between AA100 and AA3 samples. The amount of mRNA used for sequencing library generation is shown in parentheses.
Figure 4
Figure 4. Graded expression of putative target genes of the Activin A/TGFβ signaling pathway in day 4 mESCs.
(a) Schematic representation of the experimental setup. Mouse ESCs were differentiated in serum free conditions and different dosages of Activin A and SB-431542 were introduced to create a graded activation of the Activin A/TGFβ signaling pathway. Cells were harvested at day 4 for sequencing library generation. Differential gene expression analysis identified ~15–20% of expressed transcripts as differentially regulated in each sample in comparison with untreated controls (see Supplementary Methods online). (b) Regulation of Activin A pathway components in response to SB-431542 and Activin A. (c) Putative TGFβ target genes in differentiating mESCs at day 4. The heat map corresponds to fold changes observed for transcripts in comparison to untreated control. Putative target genes were classified as transcripts that followed opposite trends of regulation upon treatment with Activin A and SB. Fifty transcripts were successively up-regulated while 23 transcripts followed graded down-regulation with increasing dosages of Activin A. The majority of the TGFβ target genes (marked with *) had FoxH1 transcription factor binding sites separated by 30–200 bp (also called ASE) in 10 Kb upstream and downstream of the transcription start site. Known TGFβ target genes are highlighted in bold. Low copy number transcripts (RPKM < 3 in AA3 sample) are displayed in red font.
Figure 5
Figure 5. Lineage segregation between neuro-ectoderm and PS (mesoderm and definitive endoderm) achieved by modulation of Activin A/TGFβ signaling pathway.
(a) Schematic of the mouse embryo at embryonic day 6.5–7.5 with the gradient of Nodal expression (yellow) with the maximum expression observed in the anterior tissue. Through inhibition of TGFβ signaling pathway cells commit to the neuro-ectoderm lineage (blue). A heat map of the neuro-ectoderm associated genes is depicted (left of the embryo) with their fold changes in different samples in comparison to untreated control. The heat map on the right of the embryo depicts successive fold changes of the PS markers with varying dosages of the Activin A. The transcripts with the highest fold change in AA100 in comparison with AA15 are enriched for definitive endoderm and other anterior tissue markers. Other PS transcripts are expected to have diffused expression pattern all throughout the streak. Genes with known expression in Theiler stages 9–11 of mouse embryo are highlighted in bold (MGI database). Low copy number transcripts (RPKM < 3 in the AA3 sample) are displayed in red font. (b) Small molecule inhibition of Wnt signaling pathway (IWR-1) induced the neuro-ectoderm lineage. The fold changes are normalized to the AA3 sample. (c) BMP4 enhanced expression of posterior and extraembryonic mesoderm markers at the expense of anterior markers. Quantitative RT-PCR fold changes for two BMP4 dosages are normalized with respect to Activin A alone induction. Error bars represent the standard deviation in biological replicates (n = 3). Asterisks indicate p > 0.05 (Student's t-test) compared to controls.

References

    1. Asmann Y. W. et al. 3' tag digital gene expression profiling of human brain and universal reference RNA using Illumina Genome Analyzer. BMC Genomics 10, 531 (2009). - PMC - PubMed
    1. Marguerat S. & Bahler J. RNA-seq: from technology to biology. Cell Mol Life Sci 67, 569–579 (2010). - PMC - PubMed
    1. Marioni J. C., Mason C. E., Mane S. M., Stephens M. & Gilad Y. RNA-seq: an assessment of technical reproducibility and comparison with gene expression arrays. Genome Res 18, 1509–1517 (2008). - PMC - PubMed
    1. Wang Z., Gerstein M. & Snyder M. RNA-Seq: a revolutionary tool for transcriptomics. Nat Rev Genet 10, 57–63 (2009). - PMC - PubMed
    1. Metzker M. L. Sequencing technologies - the next generation. Nat Rev Genet 11, 31–46 (2010). - PubMed

Publication types