. 2013:1013:93-127.
doi: 10.1007/978-1-62703-426-5_7.

A novel approach to quantify G-protein-coupled receptor dimerization equilibrium using bioluminescence resonance energy transfer

Affiliations

A novel approach to quantify G-protein-coupled receptor dimerization equilibrium using bioluminescence resonance energy transfer

Irina Kufareva et al. Methods Mol Biol. 2013.

Abstract

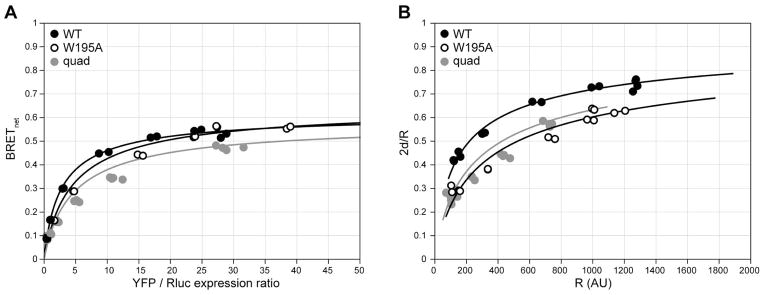
Along with other resonance energy transfer techniques, bioluminescence resonance energy transfer (BRET) has emerged as an important method for demonstrating protein-protein interactions in cells. In the field of G-protein-coupled receptors, including chemokine receptors, BRET has been widely used to investigate homo- and heterodimerization, a feature of their interactions that is emerging as integral to function and regulation. While demonstrating the existence of dimers for a given receptor proved to be fairly straightforward, quantitative comparisons of different receptors or mutants are nontrivial because of inevitable variations in the expression of receptor constructs. The uncontrollable parameters of the cellular expression machinery make amounts of transfected DNA extremely poor predictors for the expression levels of BRET donor and acceptor receptor constructs, even in relative terms. In this chapter, we show that properly accounting for receptor expression levels is critical for quantitative interpretation of BRET data. We also provide a comprehensive account of expected responses in all types of BRET experiments and propose a framework for uniform and accurate quantitative treatment of these responses. The framework allows analysis of both homodimer and heterodimer BRET data. The important caveats and obstacles for quantitative treatment are outlined, and the utility of the approach is illustrated by its application to the homodimerization of wild-type (WT) and mutant forms of the chemokine receptor CXCR4.


Figures

Figure 1
Figure 1
Parallel GPCR dimer configurations observed by X-ray crystallography. The grey tubes in the middle represent a superposition of GPCR monomers from multiple X-ray structures while the peripheral blobs illustrate the orientation of their crystallographic dimer partners. The structures are viewed from the extracellular side across the membrane. In different structures, the crystallographic dimer interfaces involve helices 1 and 2, 1 and 7, 4 and 5, 5 and 6, or 3 and 4. For some receptors like CXCR4, bRho and S1PR1, more than one dimer configuration was observed. Several interface hypotheses are partially supported by biochemical studies [38, 39]. The methods described in this chapter will allow a quantitative assessment of dimer interface mutants by BRET.
Figure 2
Figure 2
The principle of the BRET experiment. (A) When the two proteins of interest do not dimerize, the luciferase emission spectrum is unchanged and the background ratio of emission intensities at 530 nm and 480 nm is observed. (B) When the proteins interact, the proximity of the Rluc and YFP molecules results in resonance energy transfer and a change in the shape of the emission spectrum with a reduction in the emission at 480 and an increase at 530nm. The resulting combined emission spectrum is characterized by a larger ratio of emission intensities at 530 nm and 480 nm, with the degree of increase being indicative of the extent of energy transfer. The degree of transfer, in turn, is affected by several parameters discussed in text.
Figure 3
Figure 3
Specifics of the BRET assay for heterodimerization studies. (A) A schematic illustration of some possible reasons for lower BRETmax in a heterodimerization assay. Reasons include compartmentalization of the Rluc donor-tagged receptor, so that it is sequestered from the YFP acceptor-tagged receptor and therefore unavailable for interaction, and a preference of the donor-tagged receptor for homodimerization, which may again render the donor-tagged receptor unavailable for interaction with the acceptor-tagged receptor. While acceptor homodimerization may also have detrimental impact on the BRET signal intensity, in practice it is addressed by simply increasing the acceptor expression levels. (B) BRET titration curves for the CXCR4/CXCR7 heterodimer compared to the CXCR4 homodimer. The much smaller curve for the heterodimer likely result from one or both of the reasons mentioned above.
Figure 4
Figure 4
Commonly used transfection schemes in BRET titration experiments. In a conventional scheme, the Rluc expression is held constant between the samples while YFP is varied. Type 1 and type 2 experiments require maintaining either total Rluc + YFP density (type 1) or YFP/Rluc ratio (type 2) constant, while varying the other parameter (YFP/Rluc ratio for type 1 and total density for type 2). (A) A 2D representation of the assay schemes on the Rluc vs YFP plane. (B) A projection of the three BRET transfection schemes onto a 3D BRET response surface. The surface illustrates how BRET response in a system with a given dimer equilibrium dissociation constant Kd depends simultaneously on the surface densities of Rluc- and YFP-tagged receptors. Notice that a typical BRET experiment following any of the three schemes corresponds to a 2D slice of the 3D BRET response surface.
Figure 5
Figure 5
Interpretation of curves obtained in a “conventional” BRET titration experiment as proposed in [49]. Variations in the BRETmax suggest a conformational change between the binding partners while variations in BRET50 are interpreted as changes in association affinity. The limits of applicability of this scheme are discussed in text.
Figure 6
Figure 6
Simulated surfaces of (A) BRET response and (B) fraction of receptor found in homodimers at varying surface densities of Rluc- and YFP-tagged receptors (shown on horizontal plane axes). BRET response (A) reflects the fraction of Rluc donor-tagged receptors that are in dimers with YFP acceptor-tagged receptors and does not take into account other possible homodimers (i.e. YFP/YFP or Rluc/Rluc homodimers). In contrast, fraction of receptor in dimers (B) represents all possible dimers. Varying association kd results in changes of the surface shapes. These two types of 3D surfaces aid in understanding the pitfalls of quantitative interpretation of BRET data (see text for details).
Figure 7
Figure 7
Simulated BRET responses for transient (A, C, E) and obligate (B, D, F) homodimers in a conventional (A, B), type I (C, D) and type 2 (E, F) BRET titration experiments. The 3D plots in the leftmost column illustrate BRET responses as a function of the surface density of Rluc-tagged and YFP-tagged receptors. Highlighted in thicker lines are slices taken at four Rluc densities for a conventional experiment (A, B), four total receptor densities for a type 1 experiment (C, D), and four YFP/Rluc ratios for a type 2 experiment (E, F). The second column contains projections of the same slices onto more traditional 2D coordinates. The third and fourth columns are results of translation of the corresponding BRET responses into monomer-dimer equilibrium schemes using the equations described in the text.
Figure 8
Figure 8
Potential BRET quantification errors. (A) and (B): disregarding variations in the expression levels between different constructs may lead to false conclusions about their relative homodimerization affinities. (A) Constructs 1 and 2 which have different homodimerization affinities and different overall expression levels can produce indistinguishable curves in coordinates of BRET response vs YFP/Rluc ratio. (B) On the other hand, constructs 3 and 4 with identical homodimerization affinities but different expression levels can translate into different curves on the BRET response vs YFP/Rluc ratio plane. In both (A) and (B), the two constructs produce un-matching slices of their respective (distinct) 3D BRET response surfaces; this information is lost when the responses are plotted in 2D against YFP/Rluc ratio. (C) and (D): despite the constant DNA transfection amounts, levels of Rluc-tagged receptor expression may decline (C) or increase (D) in samples with higher YFP-tagged receptor expression, as indicated by changes in the unfiltered luminescence. The plots represent data obtained in a CXCR4 homodimerization experiment (C) and in an undisclosed GPCR heterodimerization experiment (D). (E) Quantification errors due to disregarding the interdependence of expression levels of Rluc- and YFP tagged constructs. If the Rluc-tagged receptor expression changes when the YFP-tagged receptor is varied, the problem can be thought of as taking non-parallel slices from the 3D BRET response surfaces, which can lead to artifacts of interpretation.
Figure 9
Figure 9
Homo-dimerization of CXCR4 and selected points mutants of the TM5-TM6 interface observed in crystallography. (A) BRETnet ratio is plotted against the YFP/Rluc expression ratio; (B) the same data converted to fraction of receptor in dimers plotted against the total surface density of the receptor. Differences between dimerization parameters have been clarified by correcting for variations in Rluc-tagged receptor expression between constructs and by converting the BRETnet/BRETmax values into 2d/R values using Eq. (7) (see text). This example illustrates the advantages of the discussed additions to the data analysis. *quad = L194A/W195A/L267A/E268A.

Similar articles

Cited by

References

    1. Whorton MR, Bokoch MP, Rasmussen SG, Huang B, Zare RN, Kobilka B, Sunahara RK. A monomeric G protein-coupled receptor isolated in a high-density lipoprotein particle efficiently activates its G protein. Proc Natl Acad Sci U S A. 2007;104:7682–7687. - PMC - PubMed
    1. Bayburt TH, Leitz AJ, Xie G, Oprian DD, Sligar SG. Transducin activation by nanoscale lipid bilayers containing one and two rhodopsins. J Biol Chem. 2007;282:14875–14881. - PubMed
    1. Angers S, Salahpour A, Bouvier M. Dimerization: an emerging concept for G protein-coupled receptor ontogeny and function. Annu Rev Pharmacol Toxicol. 2002;42:409–435. - PubMed
    1. Springael JY, Urizar E, Parmentier M. Dimerization of chemokine receptors and its functional consequences. Cytokine Growth Factor Rev. 2005;16:611–623. - PubMed
    1. Terrillon S, Bouvier M. Roles of G-protein-coupled receptor dimerization. EMBO Rep. 2004;5:30–34. - PMC - PubMed

Publication types

Substances

LinkOut - more resources