. 2013 Jul;41(12):6018-33.
doi: 10.1093/nar/gkt346. Epub 2013 Apr 26.

MYCN and HDAC2 cooperate to repress miR-183 signaling in neuroblastoma

Affiliations

MYCN and HDAC2 cooperate to repress miR-183 signaling in neuroblastoma

Marco Lodrini et al. Nucleic Acids Res. 2013 Jul.

Abstract

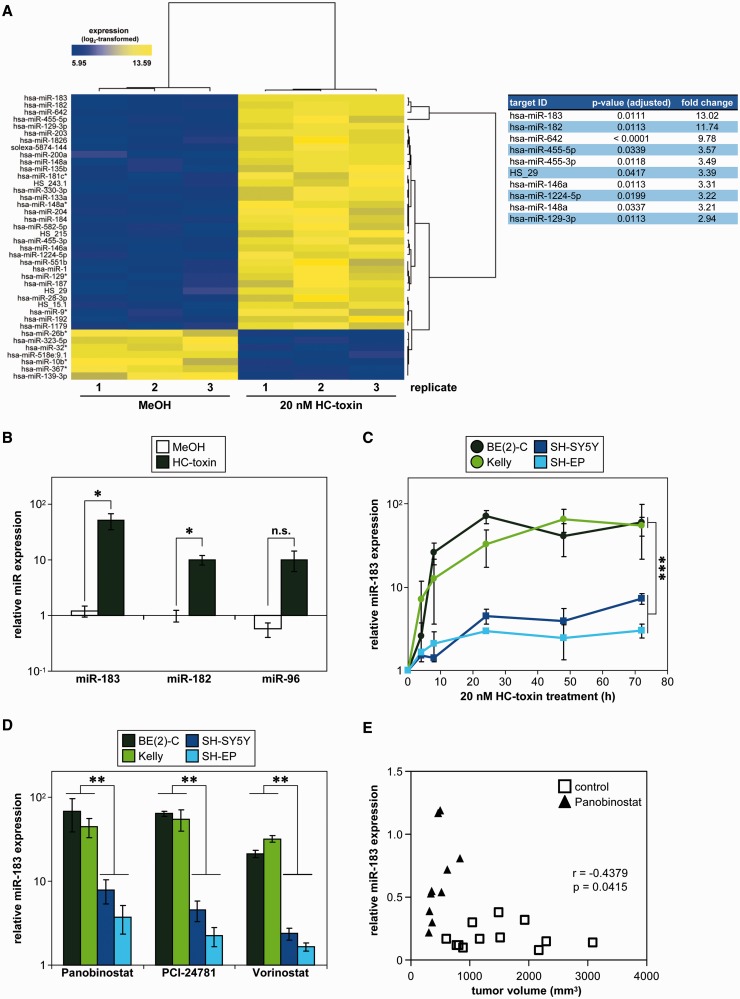
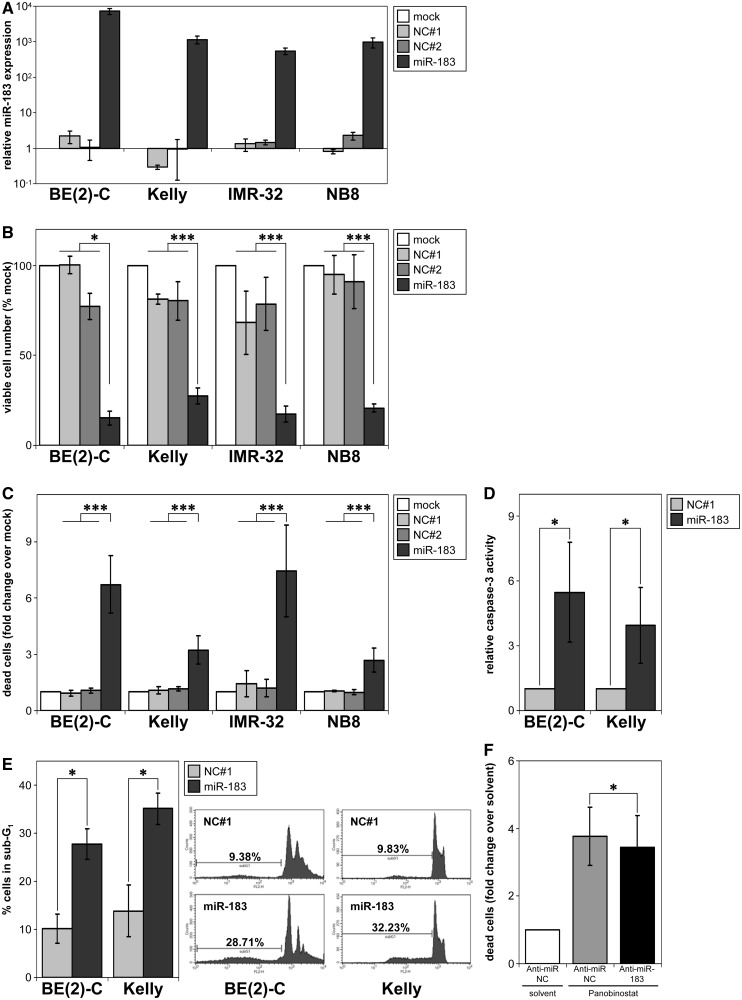
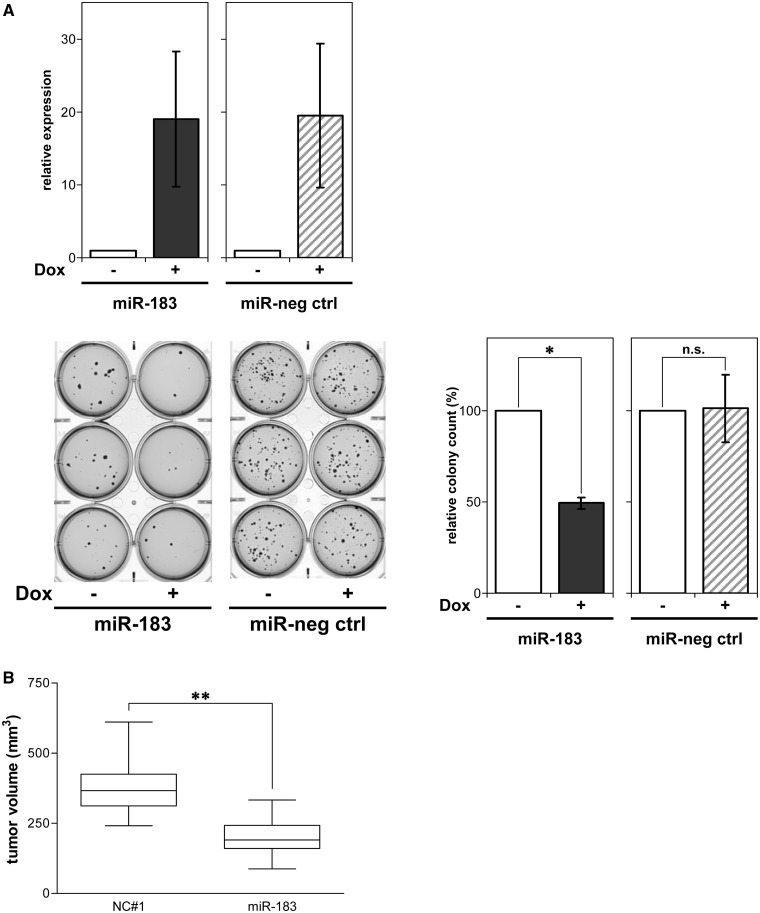
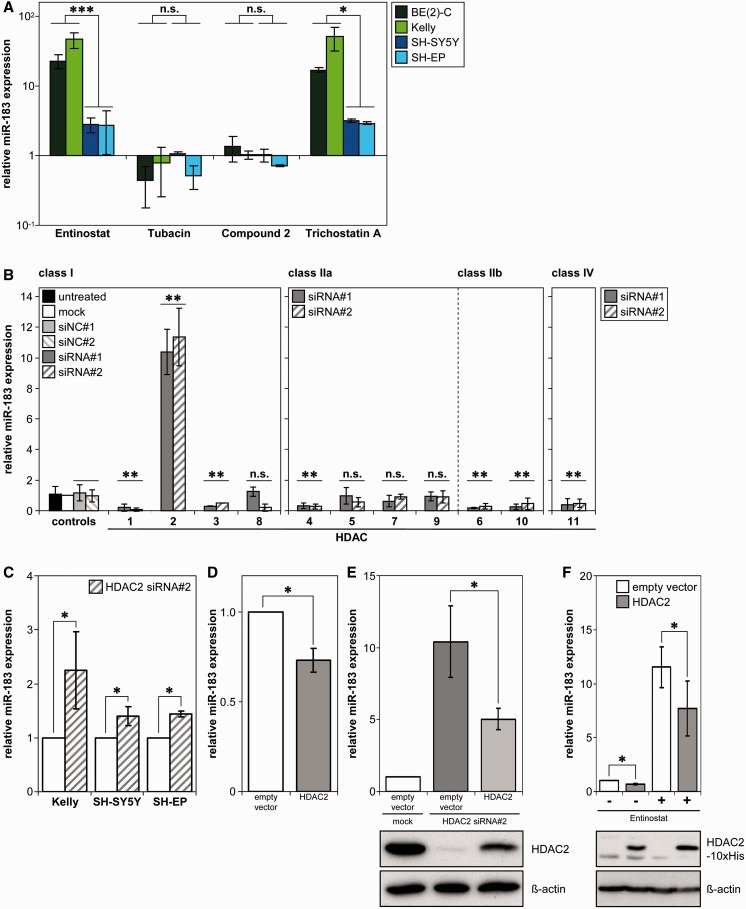
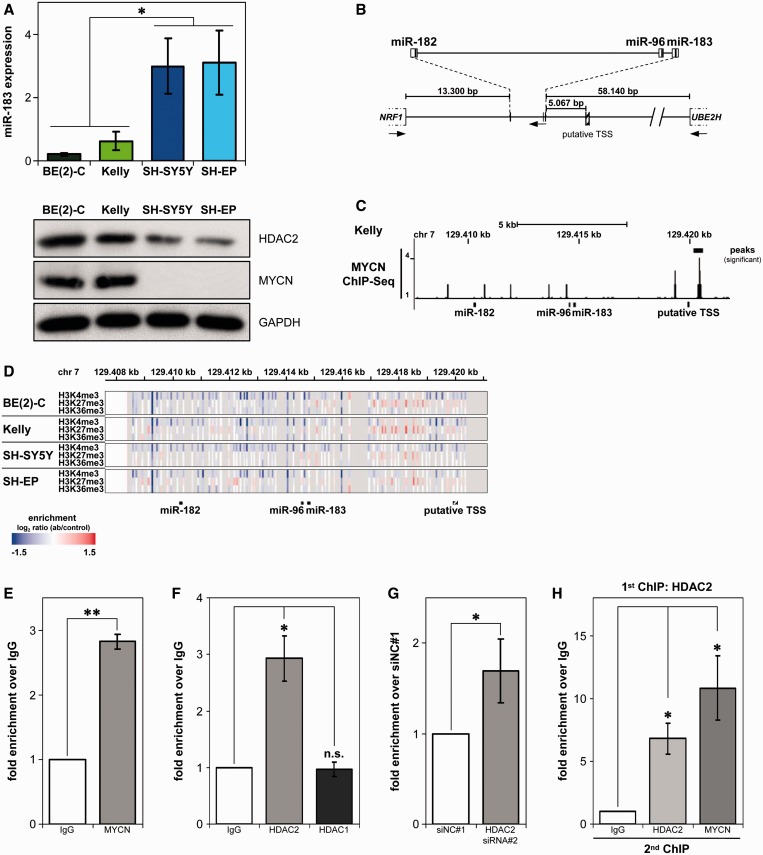
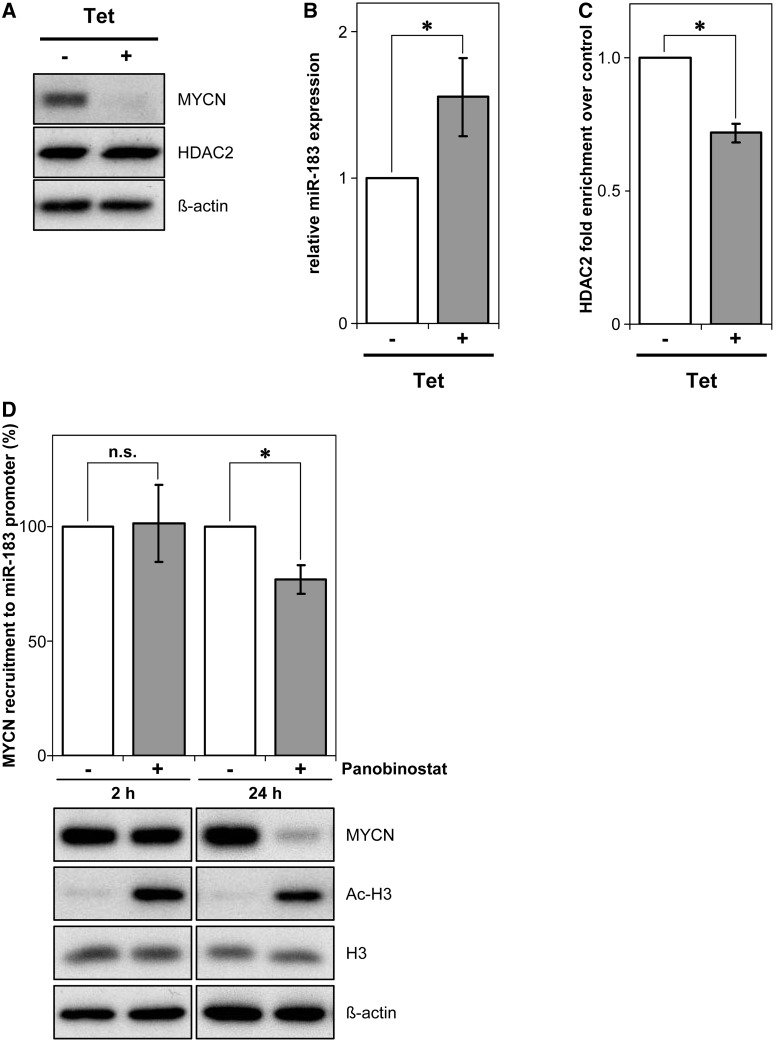
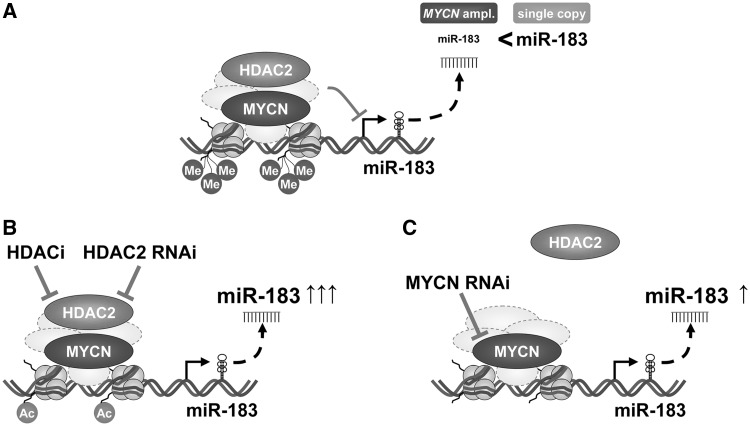
MYCN is a master regulator controlling many processes necessary for tumor cell survival. Here, we unravel a microRNA network that causes tumor suppressive effects in MYCN-amplified neuroblastoma cells. In profiling studies, histone deacetylase (HDAC) inhibitor treatment most strongly induced miR-183. Enforced miR-183 expression triggered apoptosis, and inhibited anchorage-independent colony formation in vitro and xenograft growth in mice. Furthermore, the mechanism of miR-183 induction was found to contribute to the cell death phenotype induced by HDAC inhibitors. Experiments to identify the HDAC(s) involved in miR-183 transcriptional regulation showed that HDAC2 depletion induced miR-183. HDAC2 overexpression reduced miR-183 levels and counteracted the induction caused by HDAC2 depletion or HDAC inhibitor treatment. MYCN was found to recruit HDAC2 in the same complexes to the miR-183 promoter, and HDAC2 depletion enhanced promoter-associated histone H4 pan-acetylation, suggesting epigenetic changes preceded transcriptional activation. These data reveal miR-183 tumor suppressive properties in neuroblastoma that are jointly repressed by MYCN and HDAC2, and suggest a novel way to bypass MYCN function.


Figures

Figure 1.
Figure 1.
pan-HDACi strongly induce miR-183 in neuroblastoma cell lines and xenografts in mice. (A) Heat map representation of miRNA profiling (left panel) indicates significantly (P < 0.05) up- (yellow) or down-regulated (blue) miRNAs in BE(2)-C cells treated for 24 h with HC-toxin or solvent control (methanol; MeOH). The miRNAs most strongly up-regulated are indicated together with the fold-change expression over the solvent control and adjusted P-values (right panel). (B) Validation of strongest miR-183 induction and miR-182/miR-96 induction by HC-toxin. BE(2)-C cells were treated as described in (A). Expression was measured by qRT-PCR and is shown relative to untreated controls (mean ± SD) on a log scale. (C) HC-toxin induced and maintained miR-183 expression over 72 h of treatment in four neuroblastoma cell lines. Expression was measured by qRT-PCR, and is shown at several time points relative to the respective solvent-treated control cells (as mean ± SD) on a log scale. miR-183 induction compared to solvent control was significant for all cell lines (P < 0.05). Statistical analysis further compared MYCN-amplified cell lines (green-tone lines) with cell lines having a single MYCN copy (blue-tone lines). (D) Cell lines were treated for 24 h with different clinically relevant pan-HDACi (20 nM Panobinostat, 0.25 µM PCI-24781 or 1 µM Vorinostat), and miR-183 induction was measured by qRT-PCR. Expression relative to solvent-treated controls (mean ± SD) is shown on a log scale. Statistical analysis compared MYCN-amplified (green-tone bars) with single-copy (blue-tone bars) cell lines for each pan-HDACi. (E) CB17-SCID mice carrying subcutaneous BE(2)-C cell xenografts were treated with 15 mg/kg/d Panobinostat or solvent (control) injected daily intraperitoneally for 5 d/week for 2 weeks. Significant correlation of miR-183 expression relative to solvent-treated xenograft tumors and xenograft tumor volumes are shown from treatment day 14. Pearson’s correlation coefficient (r) and P-value are indicated. Relative miR-183 expression in xenografts was calculated using a standard curve. *P ≤ 0.05; **P ≤ 0.001; ***P ≤ 0.0001; n.s., not significant.
Figure 2.
Figure 2.
miR-183 induces cell death in vitro. (A) Cell lines or NB8 spheres were transiently transfected with miR-183 or negative controls (NC#1 and #2), and miR-183 expression was measured using qRT-PCR 96 h after transfection. Expression relative to mock-transfected control cultures (mean ± SD) is shown on a log scale. (B) Cell lines or NB8 spheres were transiently transfected as described in (A), and viable cells were counted using trypan blue staining and automated cell counting. The mean ± SD of viable cells (not stained with trypan blue) counted relative to the number of viable cells in mock-transfected control cultures (=100%) are shown. (C) Mean numbers (±SD) of trypan blue-positive cells from cultures described in (B) relative to mock-transfected cells (=1). (D) Cell lines were transiently transfected with miR-183 or negative control (NC#1), and analysed for caspase-3-like activity 72 h after transfection. Mean ± SD caspase-3-like activity is displayed relative to that of the negative control. (E) Cells were stained with propidium iodide 72 h after transfection with miR-183 or negative control (NC#1). The percentage of cells in the sub-G1 phase is shown. (F) BE(2)-C cells were transiently transfected with anti-miR-183 inhibitor or anti-miR negative control (Anti-miR-NC). About 18 h after transfection, cells were treated with 20 nM Panobinostat or solvent for 72 h. Number of dead cells were counted using trypan blue staining and automated cell counting (mean numbers of trypan blue-positive cells relative to Anti-miR-NC-transfected and solvent-treated cells ± SD). *P ≤ 0.05; ***P ≤ 0.0001.
Figure 3.
Figure 3.
miR-183 inhibits colony formation in soft agar and suppresses neuroblastoma xenograft growth in mice. (A) The BE(2)-C cell line was stably transfected with doxycycline-inducible expression constructs for miR-183 or a miR negative control (miR-neg ctrl). miR-183 or miR-neg ctrl expression upon treatment with or without doxycycline (Dox) for 24 h was measured by qRT-PCR (mean ± SD) (upper panel). Colony growth in soft agar under continuous treatment with or without doxycycline (Dox) is shown for representative cultures after staining with crystal violet (lower-left panel). The results of the soft agar assays are presented as bar graphs of the mean number of colonies (±SD) forming in doxycycline-treated cultures relative to solvent-treated cultures (set to 100%) (lower-right panel). (B) BE(2)-C cells were transiently transfected with miR-183 or negative control (NC#1), and subcutaneously injected into CB17-SCID mice 48 h after transfection. Xenograft tumor volumes after 8 days are presented as box plots, and were compared using the Mann–Whitney U test. *P ≤ 0.05; **P ≤ 0.001; n.s., not significant.
Figure 4.
Figure 4.
HDAC2 negatively regulates miR-183 expression. (A) Cell lines were treated 24 h with 1 µM Entinostat, 5 µM Tubacin, 40 µM Compound 2 or 75 nM Trichostatin A, then miR-183 expression was measured using qRT-PCR. Relative expression to expression in solvent control is shown as mean ± SD on a log scale. Statistical analysis compared MYCN-amplified (green-tone bars) with MYCN-single-copy (blue-tone bars) cell lines treated with each HDACi. (B) BE(2)-C cells were transiently transfected with 2 siRNAs (siRNA#1, #2) to specifically silence each HDAC (x-axis) or negative control siRNAs (siNC#1, siNC#2), and miR-183 expression was analysed using qRT-PCR 96 h after transfection. Relative expression to mock-transfected cells is presented as mean ± SD, and statistics compared siRNA-transfected pairs with negative control-transfected pairs for each HDAC. (C) Neuroblastoma cell lines were transiently transfected with siRNA#2 targeting HDAC2. Following HDAC2 knockdown (96 h post-transfection), miR-183 expression was analysed via qRT-PCR. Mean expression relative to mock-transfected cells is presented (±SD). (D) HDAC2 expression was enforced in BE(2)-C cells via transient transfection with a HDAC2 expression construct, and miR-183 expression was analysed by qRT-PCR 72 h after transfection. Mean expression relative to empty vector-transfected cells ± SD is shown. (E) Enforced HDAC2 expression counteracted induction of miR-183 by HDAC2 knockdown. BE(2)-C cells were transiently transfected with siRNA#2 against HDAC2, and 24 h later with the HDAC2 expression construct. Cells were harvested 120 h after siRNA and 96 h after plasmid transfection and qRT-PCR performed for miR-183 expression (mean expression relative to empty vector- and mock-transfected cells ± SD). Western blot for HDAC2 expression 72 h after siRNA and 48 h after plasmid transfection with the ß-actin loading control are shown below. (F) Enforced HDAC2 expression counteracted miR-183 induction upon HDACi treatment. BE(2)-C cells were transiently transfected with the HDAC2 expression construct followed by treatment with 1 µM Entinostat or solvent control. RNA was extracted 72 h after transfection and 24 h after HDACi treatment and qRT-PCR performed for miR-183 expression (mean expression relative to empty vector- and solvent-treated cells ± SD). Western blot for His-tagged HDAC2 using an anti-Penta-His antibody with the ß-actin loading control are shown below. *P ≤ 0.05; **P ≤ 0.001; ***P ≤ 0.0001; n.s., not significant.
Figure 5.
Figure 5.
MYCN and HDAC2 are recruited to the miR-183 promoter region in the same complexes. (A) qRT-PCR analysis of endogenous miR-183 expression levels in neuroblastoma cell lines. Western blots for HDAC2 and MYCN expression with the GAPDH loading control are shown below each cell line. Statistical analysis compared cell lines with (green-tone bars) and without (blue-tone bars) MYCN amplifications. (B) Schematic representation of genomic localization and organization of the miR-183 cluster (based on the UCSC genome browser, GRCh37/hg19 assembly, February 2009) with distances to neighboring protein-coding genes. TSS, region of predicted putative transcription start site; arrows, direction of transcription. (C) ChIP-Seq analysis from Kelly cell lysates using an antibody detecting MYCN showing MYCN association in the promoter region of miR-183 cluster (black bars) superimposed on the miR-183 cluster genomic organization. (D) Enrichment of H3K27 tri-methylation at the miR-183 promoter region in MYCN-amplified cell lines. Heat map representing ChIP-on-chip data for the H3K4me3, H3K27me3 and H3K36me3 epigenetic marks at the miR-183 cluster in neuroblastoma cell lines superimposed on the genomic probe localization. Enrichment was calculated as the log2 ratio of antibody (ab) to control, and is shown as graded color bars ranging from no binding (blue) to strong binding (red). (E, F) ChIP analysis in BE(2)-C cell lysates showing MYCN (E) and HDAC2 (F) recruitment to the miR-183 promoter region and no recruitment of HDAC1 (F). Bars represent mean relative enrichment above the IgG control (±SD), detected by qRT-PCR of the miR-183 promoter region. (G) ChIP showing increased histone H4 acetylation at the miR-183 promoter region after HDAC2 knockdown. BE(2)-C cells were transiently transfected with siRNA against HDAC2 (siRNA#2) or negative control (siNC#1), and ChIP analysis with a pan-acetyl-histone H4 antibody was performed 96 h after transfection. Bars show mean fold enrichment above siNC#1 control (±SD) measured by miR-183 promoter region qRT-PCR. (H) Re-ChIP showing recruitment of MYCN and HDAC2 in the same complexes. First ChIP conducted on BE(2)-C cell lysates with an anti-HDAC2 antibody. Chromatin precipitates used in the second ChIP with the indicated antibodies (x-axis). Bars represent mean enrichment above the Re-ChIP IgG control (±SD) detected by qRT-PCR of the miR-183 promoter region. *P ≤ 0.05; **P ≤ 0.001; n.s., not significant.
Figure 6.
Figure 6.
miR-183 repression requires MYCN and HDAC2. (A) MYCN and HDAC2 expression in the IMR-32 cell line, harboring a tetracycline-inducible MYCN shRNA expression construct, is shown after 48 h of treatment with or without tetracycline (Tet). ß-actin served as a loading control. (B) miR-183 expression was analysed by qRT-PCR in the same neuroblastoma cell model after MYCN shRNA induction. Bars show mean miR-183 expression relative to solvent-treated cells ± SD. (C) ChIP analysis with a HDAC2-specific antibody revealed less HDAC2 recruitment (gray bar) to the miR-183 promoter region in lysates of cells treated as in (A) after MYCN depletion. Mean enrichment detected by miR-183 promoter qRT-PCR relative to solvent-treated cells (±SD) is shown. (D) ChIP analysis investigating MYCN recruitment to the miR-183 promoter region upon Panobinostat treatment. BE(2)-C cells were treated with Panobinostat or solvent for 2 h or 24 h. Bars represent mean MYCN recruitment to the miR-183 promoter region (±SD) relative to solvent-treated cells at each time point (=100%) measured by miR-183 promoter region qRT-PCR. Western blot for MYCN expression and histone H3 pan-acetylation with the H3 and ß-actin loading controls are shown below. *P ≤ 0.05; n.s., not significant.
Figure 7.
Figure 7.
Schematic model of MYCN/HDAC2-mediated miR-183 repression in neuroblastoma. (A) MYCN and HDAC2 are recruited in the same complexes to the miR-183 promoter region and repress miR-183 expression. The repressive epigenetic mark, tri-methylation of H3K27, is more enriched in neuroblastoma cells harboring MYCN amplifications, and miR-183 expression is lower. (B) HDAC2 causes transcriptional repression of miR-183. HDAC2 inhibition or depletion results in miR-183 induction. Increased histone H4 pan-acetylation in the miR-183 promoter region in response to HDAC2 knockdown indicates epigenetic changes and transcriptional activation of miR-183. (C) MYCN is important for HDAC2 recruitment to the miR-183 promoter region, since MYCN depletion reduces HDAC2 recruitment to the promoter and increases miR-183 expression.

Similar articles

Cited by

References

    1. Cole KA, Maris JM. New strategies in refractory and recurrent neuroblastoma: translational opportunities to impact patient outcome. Clin. Cancer Res. 2012;18:2423–2428. - PMC - PubMed
    1. Brodeur GM. Neuroblastoma: biological insights into a clinical enigma. Nat. Rev. Cancer. 2003;3:203–216. - PubMed
    1. Schwab M, Westermann F, Hero B, Berthold F. Neuroblastoma: biology and molecular and chromosomal pathology. Lancet Oncol. 2003;4:472–480. - PubMed
    1. Westermark UK, Wilhelm M, Frenzel A, Henriksson MA. The MYCN oncogene and differentiation in neuroblastoma. Semin. Cancer Biol. 2011;21:256–266. - PubMed
    1. Bartel DP. MicroRNAs: genomics, biogenesis, mechanism, and function. Cell. 2004;116:281–297. - PubMed

Publication types

Associated data