Review
. 2013 Jul;12(4):366-80.
doi: 10.1093/bfgp/elt008. Epub 2013 Apr 26.

Explaining microbial phenotypes on a genomic scale: GWAS for microbes

Affiliations
Review

Explaining microbial phenotypes on a genomic scale: GWAS for microbes

Bas E Dutilh et al. Brief Funct Genomics. 2013 Jul.

Abstract

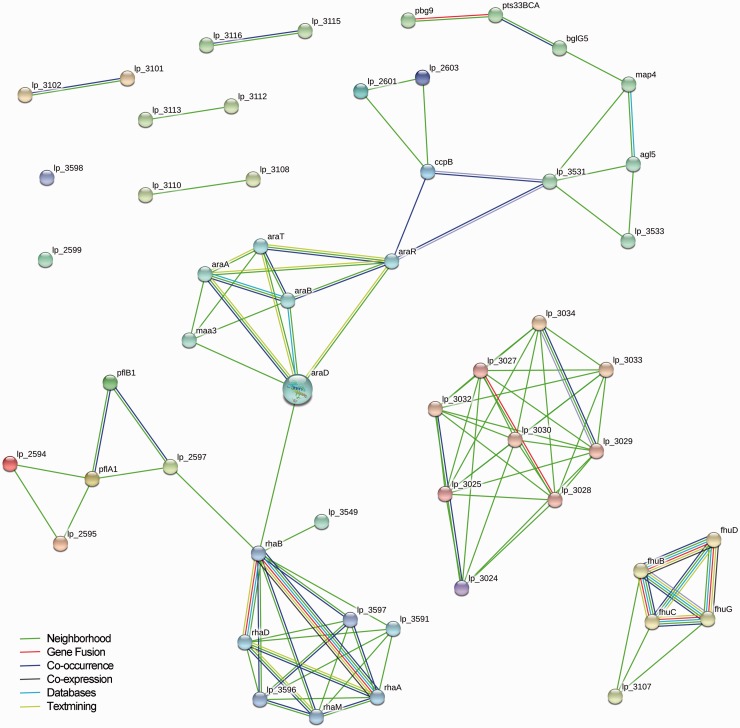
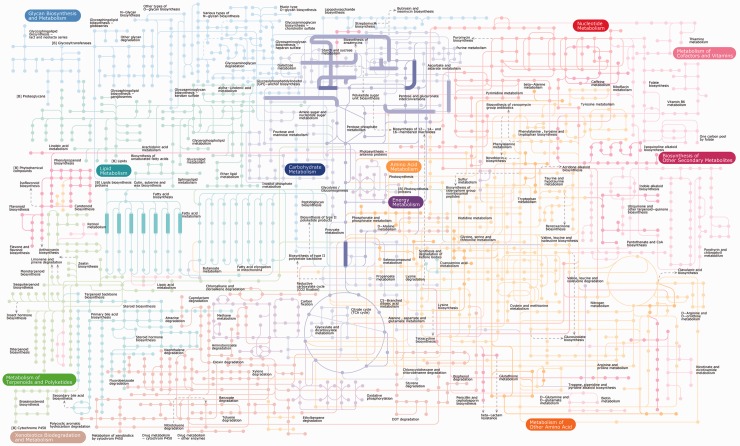
There is an increasing availability of complete or draft genome sequences for microbial organisms. These data form a potentially valuable resource for genotype-phenotype association and gene function prediction, provided that phenotypes are consistently annotated for all the sequenced strains. In this review, we address the requirements for successful gene-trait matching. We outline a basic protocol for microbial functional genomics, including genome assembly, annotation of genotypes (including single nucleotide polymorphisms, orthologous groups and prophages), data pre-processing, genotype-phenotype association, visualization and interpretation of results. The methodologies for association described herein can be applied to other data types, opening up possibilities to analyze transcriptome-phenotype associations, and correlate microbial population structure or activity, as measured by metagenomics, to environmental parameters.

Keywords: functional genomics; genome-wide association studies; genotype–phenotype association; microbial genomics; random forest.


Figures

Figure 1:
Figure 1:
The resolution of an OG depends on the age of the LCA for the studied species. The dark background tree indicates the evolutionary history of the included Bacilli; colored lines indicate the evolutionary history of the genes. Gene family A in the Bacilli duplicated in the LCA of the Lactobacillales to form the paralogs X and Y. When constructing OGs for all Bacilli, all the homologs A, X and Y will be united in one OG, where X and Y are called ‘in-paralogs’. If only Lactobacillales are taken into account, X and Y are placed in separate OGs because they had different ancestral genes in the more recent LCA. Note that when species are compared in pairs, paralogs may be mistaken for orthologs due to differential loss of paralogs, e.g. the Lactococcus lactis gene X and the L. plantarum gene Y. Orthology can be inferred at different levels of resolution by analyzing speciation events and gene duplication events in phylogenetic trees [119].
Figure 2:
Figure 2:
Flow diagram for genotype–phenotype association analysis. Genomic and phenotypic data are collected for microbial strains. Phenotypes can be determined by, e.g. phenotype microarrays or analytical profile indices. Both the genotypic and phenotypic data are then preprocessed before genotype–phenotype association analysis. In the association analysis, correlations between genotype and phenotype are determined and visualized.
Figure 3:
Figure 3:
Choosing an approach for genotype–phenotype association. (A) Dataset consisting of phenotypes (e.g. growth rates on different carbon sources) and genotypes (e.g. gene content) for 10 bacterial strains (rows). (B) Nine possible methods (four comparison of means statistical tests, three correlation analyses and two machine learning methods) for detecting genotype–phenotype associations. The compatibility with specific data types and applicability in microbial GWAS is shown. (C) Hypothetical example of a linear genotype–phenotype relation. Green strains grow on d-glucose; red strains do not. The presence of gene 8 is predictive of the growth on d-glucose. (D) Hypothetical example of a combinatorial genotype–phenotype relation. All six strains that grow on d-fructose contain gene 9 and gene 3. In other words: the interaction between gene 9 and gene 3 is predictive of the growth on d-fructose.
Figure 4:
Figure 4:
Different ways to visualize L. plantarum genes that were found to be important to predict growth or non-growth on multiple sugars using PhenoLink [26]. Color-coded table of links between the 54 selected genes and growth on different sugars using from PhenoLink. ‘Yes’ or ‘No’ suffixes in column names indicate growth and non-growth, respectively. Asterisks (*) besides gene names (rows) indicate that the gene could not be mapped to COGs (see Figure 6). The color scheme integrates the importance of genes to predict phenotypes, and their occurrence in strains with that phenotype: bright red/green indicates genes that are important to a phenotype and present/absent in ≥75% of the strains with this phenotype; dim red/green indicates genes that are not important to a phenotype but are present/absent in ≥75% of the strains with this phenotype; black indicates genes that are important to a phenotype but are not sufficiently present/absent (<75%) in strains with this phenotype; gray indicates genes that are not important to a phenotype and are not sufficiently present/absent (<75%) in strains with this phenotype.
Figure 5:
Figure 5:
Different ways to visualize L. plantarum genes that were found to be important to predict growth or non-growth on multiple sugars using PhenoLink [26]. STRING evidence graph [3] of all 53 genes important for growth or non-growth on multiple sugars (all phenotypes combined). The gene lp_3111 did not encode a protein and was omitted from this figure.
Figure 6:
Figure 6:
Different ways to visualize L. plantarum genes that were found to be important to predict growth or non-growth on multiple sugars using PhenoLink [26]. iPath global metabolic map [109] of the same genes mapped to COGs (47 unique COGs), where reactions with at least one mapped COG are indicated with a thick line.

References

    1. Bork P, Dandekar T, Diaz-Lazcoz Y, et al. Predicting function: from genes to genomes and back. J Mol Biol. 1998;283:707–25. - PubMed
    1. Gene Ontology Consortium. Creating the gene ontology resource: design and implementation. Genome Res. 2001;11:1425–33. - PMC - PubMed
    1. Szklarczyk D, Franceschini A, Kuhn M, et al. The STRING database in 2011: functional interaction networks of proteins, globally integrated and scored. Nucleic Acids Res. 2011;39:D561–8. - PMC - PubMed
    1. Korbel JO, Jensen LJ, von Mering C, et al. Analysis of genomic context: prediction of functional associations from conserved bidirectionally transcribed gene pairs. Nat Biotechnol. 2004;22:911–7. - PubMed
    1. Kensche PR, Oti M, Dutilh BE, et al. Conservation of divergent transcription in fungi. Trends Genet. 2008;24:207–11. - PubMed

Publication types

MeSH terms

LinkOut - more resources