. 2013 Mar 20;46(11):114002.
doi: 10.1088/0022-3727/46/11/114002.

Dripping and jetting in microfluidic multiphase flows applied to particle and fiber synthesis

Affiliations

Dripping and jetting in microfluidic multiphase flows applied to particle and fiber synthesis

J K Nunes et al. J Phys D Appl Phys. .

Abstract

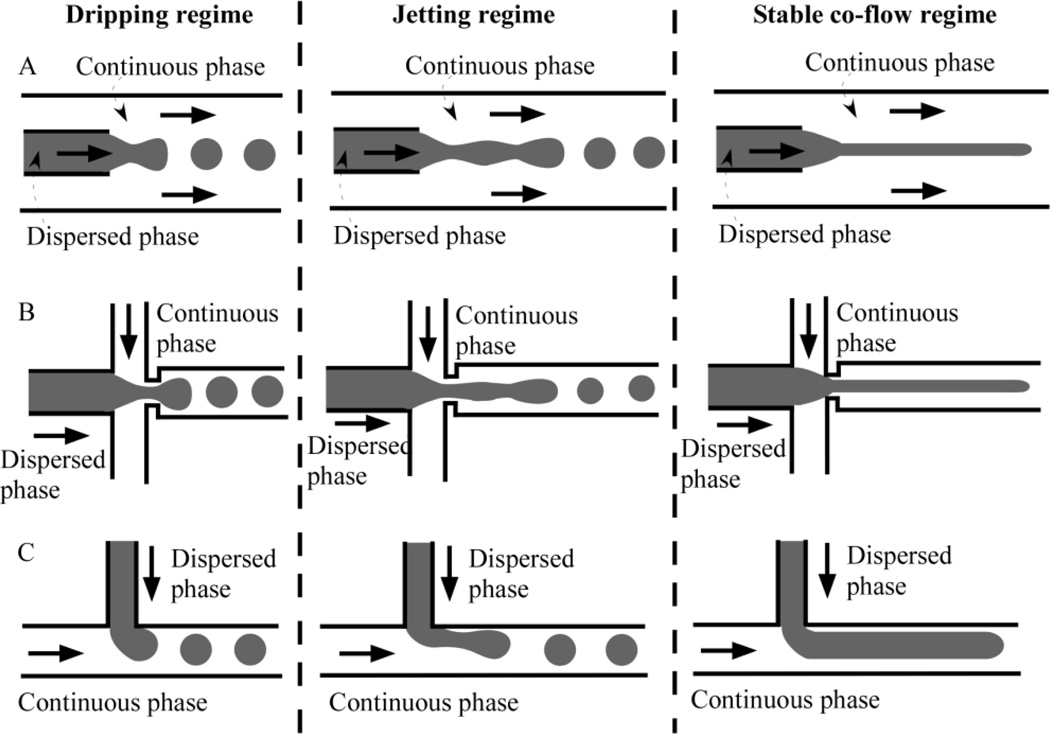
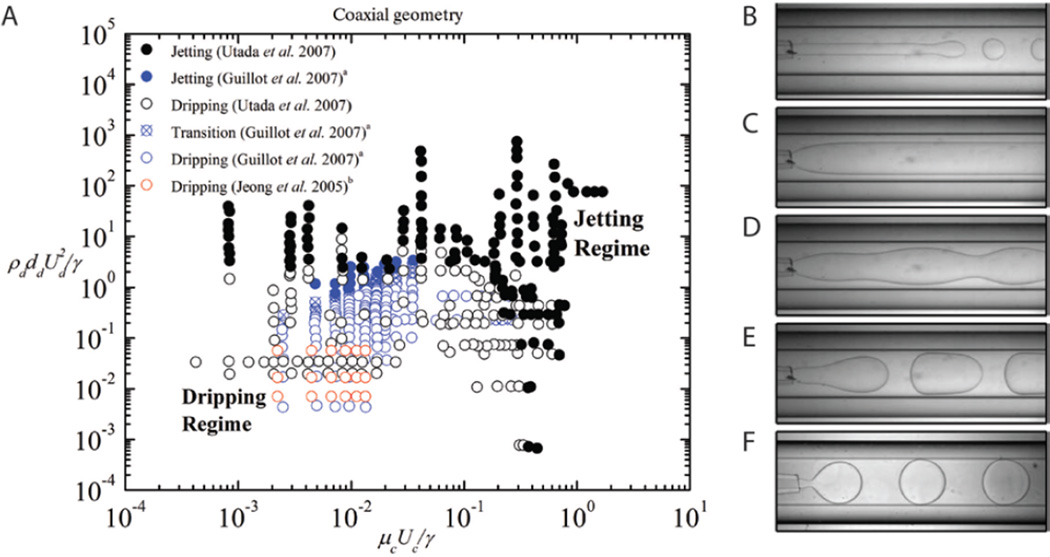
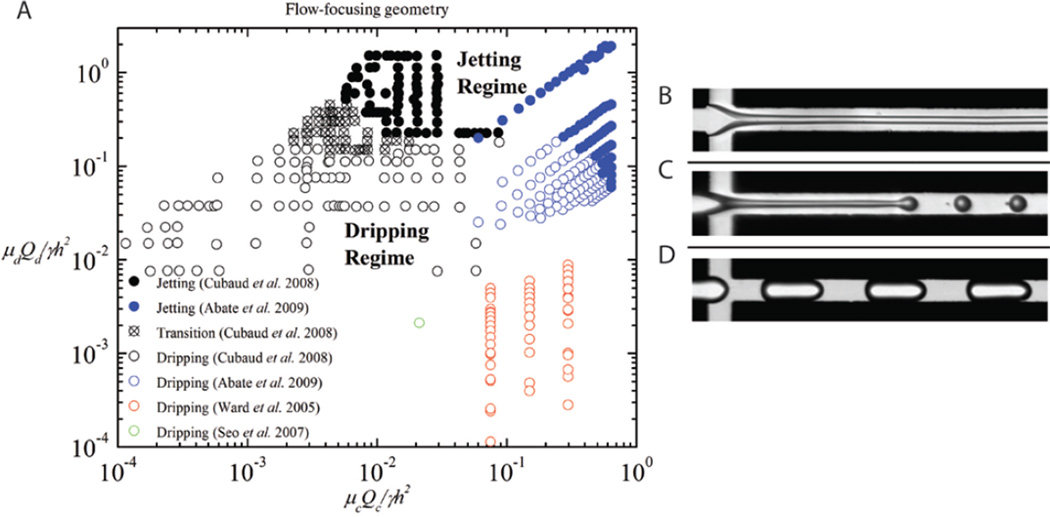
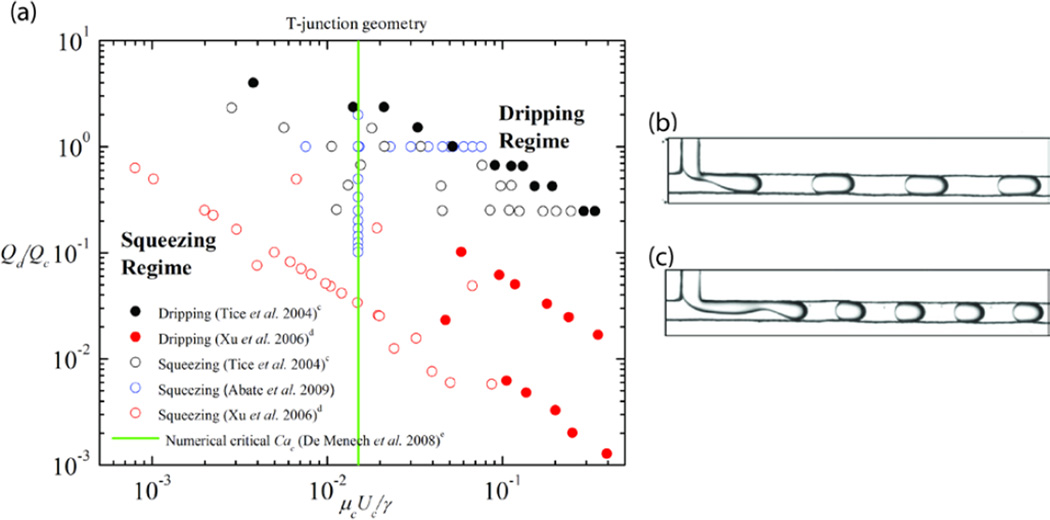
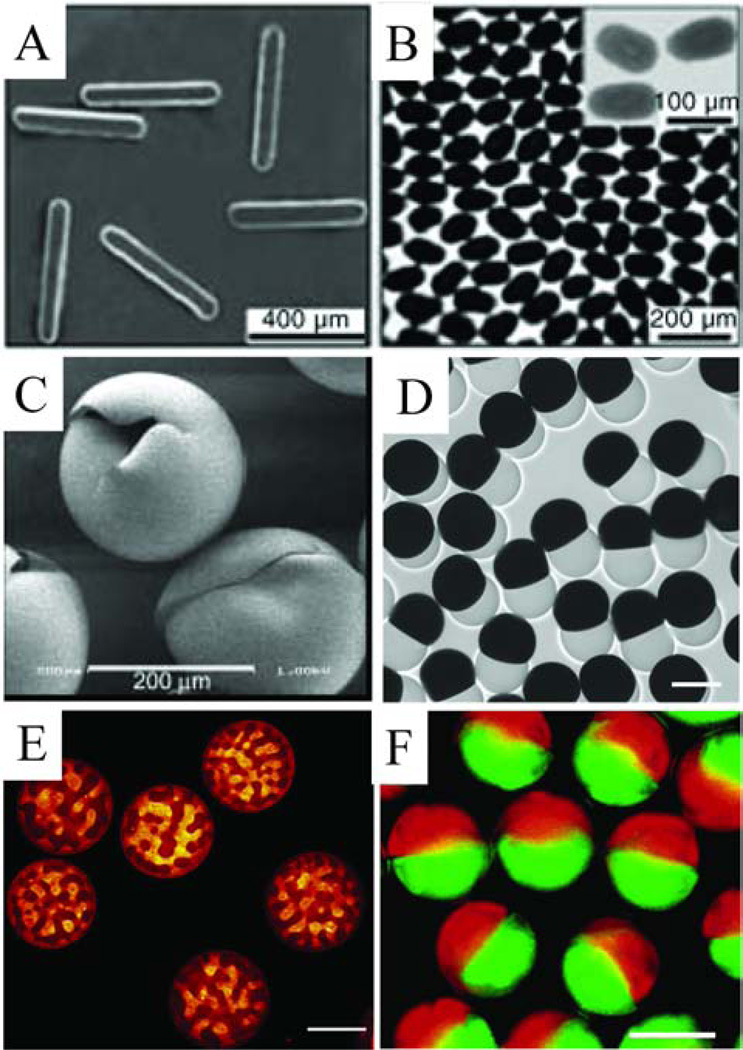
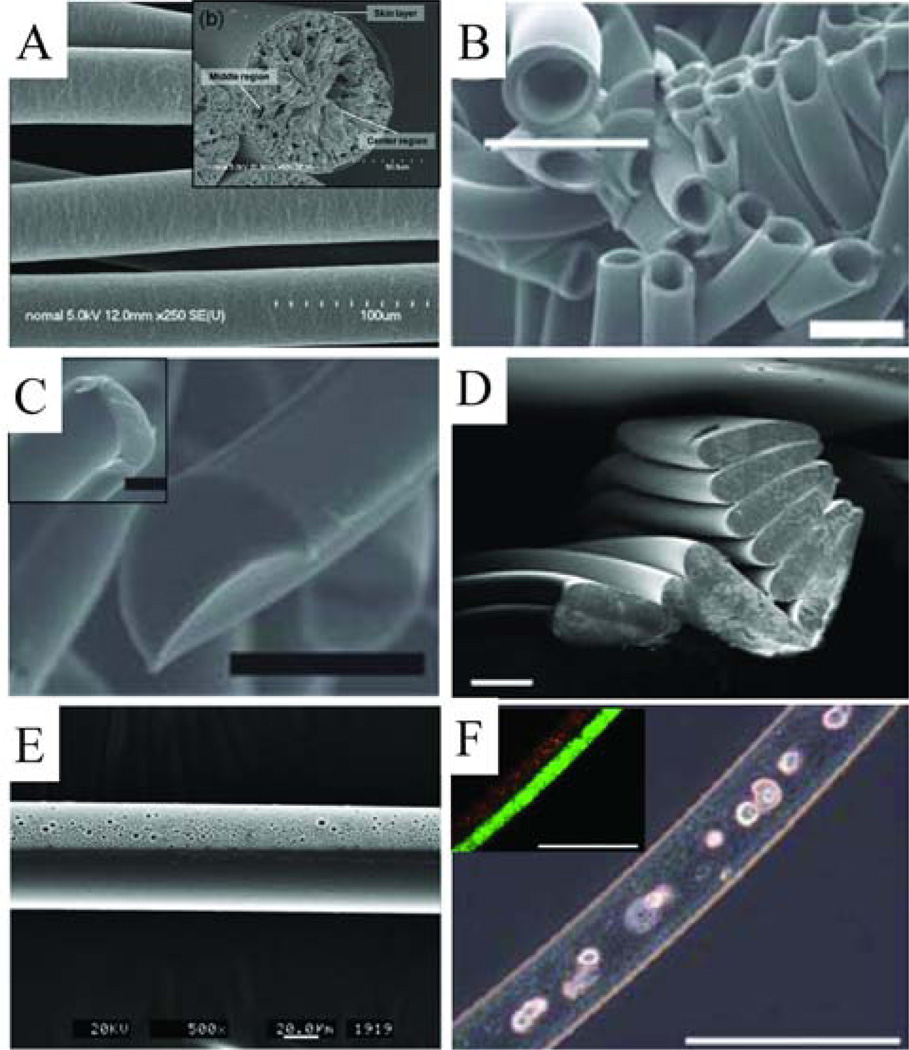
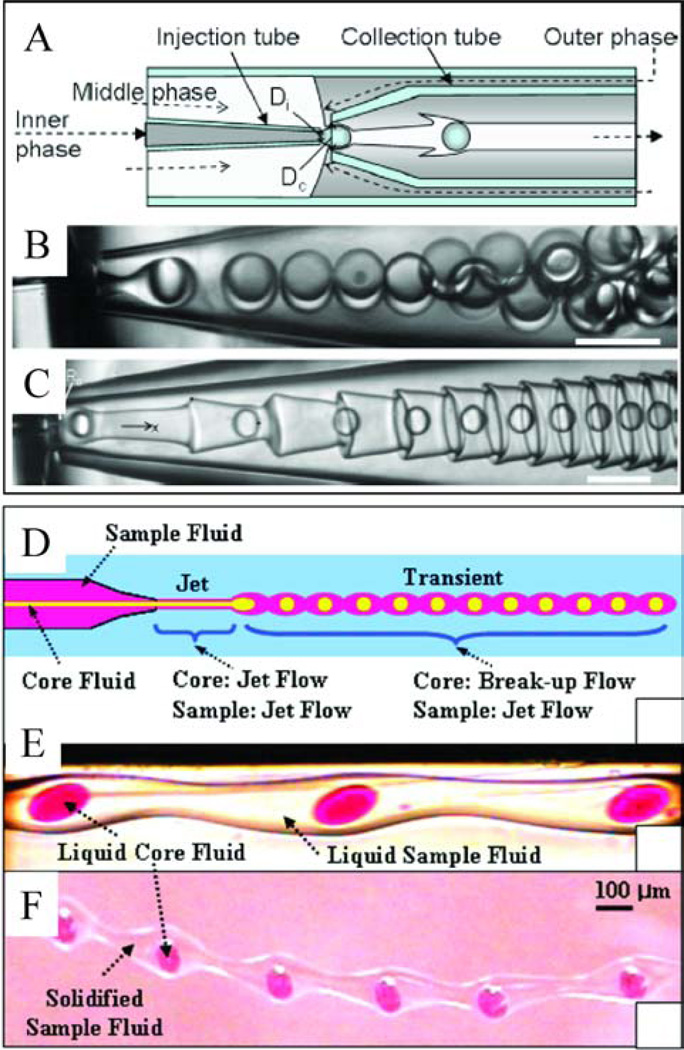
Dripping and jetting regimes in microfluidic multiphase flows have been investigated extensively, and this review summarizes the main observations and physical understandings in this field to date for three common device geometries: coaxial, flow-focusing and T-junction. The format of the presentation allows for simple and direct comparison of the different conditions for drop and jet formation, as well as the relative ease and utility of forming either drops or jets among the three geometries. The emphasis is on the use of drops and jets as templates for microparticle and microfiber syntheses, and a description is given of the more common methods of solidification and strategies for achieving complex multicomponent microparticles and microfibers.


Figures

Figure 1
Figure 1
Schematic of different flow regimes in (A) coaxial, (B) flow-focusing, and (C) T-junction microfluidic devices (not to scale). Solid arrows indicate the flow direction.
Figure 2
Figure 2
(A) Phase diagram for microfluidic coaxial geometry comparing data from Utada et al. (modified with permission from [20]. Copyright 2007 by the American Physical Society), Guillot et al. (modified with permission from [23]. Copyright 2007 by the American Physical Society) and Jeong et al. (modified with permission from [51]. Copyright 2005 American Chemical Society), and examples of observed flow patterns where (B–D) fall within the jetting regime and (E–F) are in the dripping regime of the phase diagram. ((B–F) modified from [23]. Copyright 2007 by the American Physical Society). a Glycerol density estimated using values from [52]; inner radius of capillary, rd, approximated as 20 µm (within the range of rd reported in [23]). b Density values estimated using densities of chemicals that compose the solution. To estimate the properties of the mineral oil continuous phase, it is assumed to be kerosene, so that the corresponding fluid properties (interfacial tension, viscosity) of kerosene are obtained from [52].
Figure 3
Figure 3
(A) Phase diagram for microfluidic flow-focusing geometry comparing results from Cubaud et al. (modified with permission from [57]. Copyright 2008, American Institute of Physics), Abate et al. (modified with permission from [21]. Copyright 2009 by the American Physical Society), Ward et al. [70] and Seo et al. ([73] – reproduced by permission of The Royal Society of Chemistry), and examples of observed flow patterns (B, C) in the jetting regime, and (D) in the dripping regime of the phase diagram ((B–D) modified with permission from [57]. Copyright 2008, American Institute of Physics).
Figure 4
Figure 4
(A) Phase diagram for microfluidic T-junction geometry, comparing data from Tice et al. (modified from [82]. Copyright 2004, with permission from Elsevier), Xu et al. (modified with permission from [85]. Copyright 2006 Wiley-VCH), and Abate et al. (modified with permission from [21]. Copyright 2009 by the American Physical Society), and examples of observed flow patterns (B) in the squeezing regime and (C) in the dripping regime of the phase diagram ((B–C) adapted from [82]. Copyright 2004, with permission from Elsevier). c Data from [82] used so that viscosity ratio is 1. The capillary number of the continuous phase is calculated using data from [82]. d We assume the squeezing-to-dripping transition occurs when the average drop size becomes less than the width of the microchannel, and the scaling of the drop size with the capillary number abruptly changes. e Numerical data obtained from [90].
Figure 5
Figure 5
Length of the dispersed phase fluid jet as a function of the dispersed phase flow rate for an continuous phase flow rate fixed at Qc = 30 µL/min (Reprinted with permission from [50]. Copyright 2011, American Institute of Physics).
Figure 6
Figure 6
Examples of microfluidic generated microparticles. (A) Tripropyleneglycol diacrylate microrods (reprinted from [103]); (B) bismuth alloy ellipsoids (reprinted from [103]); (C) Norland optical adhesive hollow microspheres (reprinted from [37]); (D) dumbbell-shaped Janus microparticles (perfluoropolyether/allylhydride polycarbosilane), scale bar represent 100 µm (reprinted with permission from [126]. Copyright 2009 Wiley-VCH); (E) Microparticles composed of gelatin and maltodextrin, scale bar represent 100 µm (reprinted from [120]. Copyright 2012, with permission from Elsevier); (F) Janus colloid-filled acrylamide microparticles, scale bar represents 100 µm (reprinted with permission from [127]. Copyright 2006 American Chemical Society).
Figure 7
Figure 7
Examples of microfluidic synthesized microfibers. (A) Scanning electron microscope image (SEM) of PLGA microfibers with inset image showing cross-section (reprinted with permission from [121]. Copyright 2008 American Chemical Society). (B) SEM of hollow PEG diacrylate microfibers with a higher magnification inset image, scale bars represent 50 µm ([130] – reproduced by permission of The Royal Society of Chemistry). (C) Two examples of non-circular cross-section PEG diacrylate microfibers, scale bar represents 50 µm ([130] – reproduced by permission of The Royal Society of Chemistry). (D) Non-circular cross-section crosslinked 4-hydroxybutyl acrylate microfibers, scale bar represents 100 µm ([17] – reproduced by permission of The Royal Society of Chemistry). (E) Janus polyurethane microfiber, with one solid and one porous side ([131] – reproduced by permission of The Royal Society of Chemistry). (F) Janus ‘sandwiched’ structure alginate microfibers with fibroblast cells cultured in the core, inset fluorescence image shows the two halves of the sandwich structure, scale bar represents 200 µm ([116] – reproduced by permission of The Royal Society of Chemistry).
Figure 8
Figure 8
Examples of complex multiphase flows; (A–C) Corrugated interfaces (reprinted from [145]) and (D–F) transient flows (reprinted with permission from [146]). (A) Schematic of the experimental setup for the formation of double emulsions, (B) generation of uniform double emulsion droplets, where the inner, middle and outer fluids are water, 10 % Span 80 in dodecane and water, respectively (γ between middle and outer fluids is 2.7 ± 0.2 mN/m). (C) Formation of corrugations when the interfacial tension between the middle and outer phases is significantly reduced, where the inner, middle and outer fluids are water, 2 % Span 80 in dodecane and water with 4 mM SDS, respectively (γ between middle and outer fluids is 30 ± 4 µN/m). Scale bars represent 100 µm. (D) Schematic of transient flow generation. (E) Optical microscopy images of transient liquid flow, where the inner, middle and outer fluids are dyed water, a polymerizable 4-hydroxybutyl acrylate solution and 25 % poly(vinyl alcohol) in water, respectively. (F) Solidified fiber containing liquid core droplets.

References

    1. Whitesides GM. Nature. 2006;442:368–373. - PubMed
    1. Stone HA, Stroock AD, Ajdari A. Annu. Rev. Fluid Mech. 2004;36:381–411.
    1. Baroud CN, Gallaire F, Dangla R. Lab Chip. 2010;10:2032–2045. - PubMed
    1. Christopher GF, Anna SL. J. Phys. D: Appl. Phys. 2007;40:R319–R336.
    1. Seemann R, Brinkmann M, Pfohl T, Herminghaus S. Rep. Prog. Phys. 2012;75:016601. - PubMed

Publication types