. 2013 Apr 22:7:5.
doi: 10.3389/fnana.2013.00005. eCollection 2013.

Three-dimensional reconstruction of electron micrographs reveals intrabulbar circuit differences between accessory and main olfactory bulbs

Affiliations

Three-dimensional reconstruction of electron micrographs reveals intrabulbar circuit differences between accessory and main olfactory bulbs

Keiko Moriya-Ito et al. Front Neuroanat. .

Abstract

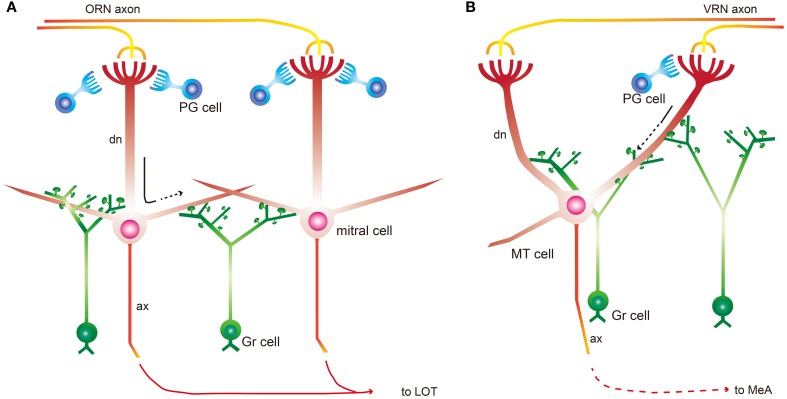
Three-dimensional (3D) reconstruction of synaptic arrangement on a particular dendrite provides essential information regarding neuronal properties and neural microcircuits. Unconventional synapses are particularly good candidates for such steric attribution. In main and accessory olfactory bulbs (MOBs and AOBs), there are dendrodendritic reciprocal synapses (RSs) between excitatory projection neurons and inhibitory interneurons. Although the fine structure and configuration of these synapses have been investigated in MOB, their characteristics in AOB were unknown. In this study, we performed 3D AOB reconstruction using serial section transmission electron microscopy. We found numerous RSs on primary dendrites from glomeruli to mitral/tufted (MT) cell somas. These synapses formed between dendritic shafts of MT cells and large dendritic spines, or so-called gemmules, of granule (Gr) cells. This indicates that chemical signals received by a glomerulus are regulated in the primary dendrite of an MT cell before reaching its soma. In MOB, RSs are located on secondary dendrites and act as lateral and self-inhibiting following mitral cell depolarization. Our results indicate that AOB intrabulbar microcircuitry is quite different from that in the MOB.

Keywords: dendritic spines; dendrodendritic reciprocal synapses; electron microscopy; gemmules; self-inhibition.


Figures

Figure 1
Figure 1
Ultrastructual morphology and 3D images of MT cell primary dendrites in the AOB. (A) Basic morphology of the MT cell apical dendrite in vivo. The sample was fixed in general fixing solution for electron microscopic observation. We can recognize the dendrite was MT cell's without labeling if we observed the proximal region of the neuron. Scale bar = 1 μm. (B) A serial micrograph of an RS in the red square in A dn, an apical dendrite of a MT cell; gm, a gemmule of a Gr cell. Arrows indicate synaptic transmission direction. Arrowheads indicate docked synaptic vesicles. Scale bar = 500 nm. (C) A schematic drawing of a rat AOB slice preparation (left panel) and the position of a biocytin-injected MT cell (red cross, left panel), and a merged image of differential interference and fluorescence of the slice reacted with avidin-FITC-gold (right panel). The red box indicates the area shown in D. Scale bar = 200 μm. (D) A confocal fluorescent image of the injected cell. The red dotted line indicates the border between the GL and MTL. The red box indicates the observed area by electron microscopy corresponding to the 3D image in E. Scale bar = 50 μm. (E) A reconstructed 3D image of the primary dendrite in D by serial electron micrography. The green object is the injected dendrite. The yellows and whites are the structures of other neurons synapsing with the MT cell. Arrows indicate synaptic transmission direction. oSSs (all excitatory synapses) are labeled in red, iSSs (mainly inhibitory synapses) are labeled in blue, and bidirectional arrows indicate RSs. Orange boxes indicate the area of F and H–J. Scale bar = 5 μm. (F) The serial electron micrographs of RS3 in E. Serial electron micrographs indicate steric composition of a labeled dendrite by silver-enhanced gold particles. Arrows indicate synaptic transmission direction. Scale bar = 1 μm. (G) The RS on another labeled MT cell. These micrographs more clearly identified intracellular structures, such as synaptic vesicles. Arrows indicate synaptic transmission direction. Arrowheads indicate synaptic vesicles. Scale bar = 500 nm. (H) The 3D image of RS3 reconstructed by serial picture in F. The right panel indicates the locations and sizes of synaptic sites (red, PSD of paired cell; blue, PSD of the labeled cell). Yellow indicates a synaptic pair structure. This RS contains 1 output and 2 input synapses. Scale bar = 1 μm. (I and J) Sample images of an oSS (oSS2) and an iSS (iSS2). Scale bars = 500 nm.
Figure 2
Figure 2
Morphological characterizations of synaptic sites. (A) The constitution of output synapses from MT cell primary dendrites to other neurons from 4 primary dendrites. These synapses categorized by synaptic type [single synapse (oSS) or reciprocal synapse (RS)] and postsynaptic architecture of paired neurons. Most synapses formed with dendritic spines. (B) The construction of input synapses from other neurons to primary dendrites of MT cells. These synapses were categorized by synaptic type (iSS or RS) and presynaptic architecture of paired neurons. All RSs formed with dendritic spines; however, presynaptic structures of iSSs were not uniform.
Figure 3
Figure 3
A 3D image of an AOB Gr cell. (A) A drawing of a prepared rat AOB slice (upper panel) and the position of a biocytin-injected Gr cell (red cross, upper panel), and a joint image of differential interference and fluorescence of the slice reacted with avidin-FITC-gold (lower panel). Scale bar = 200 μm. (B) A confocal fluorescent image of the injected cell. The red dotted line indicates the border between the MTL, the olfactory tract layer (OTL), and the GRL. The red box indicates the area observed with electron microscopy corresponding to the 3D image of C. Scale bar = 50 μm. (C) 3D reconstruction of the apical dendrite in B by serial electron micrograph. The green is the injected dendrite, and the yellow structures indicate the neuron's dendritic spines. The white structures are filopodia-like structures. Arrows indicate synaptic transmission direction. iSSs (mainly excitatory synapses) are labeled in red, oSSs (all inhibitory synapses) are labeled in blue, and bidirectional arrows indicate RSs. Orange boxes indicate the areas shown in D,E. Scale bar = 10 μm. (D and E) An example of 3D morphology of the spine containing the iSS (iSS3 in C) and the gemmule containing the RS (RS10 in C). The 3D image (left panels) was reconstructed with the serial electron micrograph of a labeled spine by silver-enhances gold particles (right panels). Numbers on the right panels indicate ultrathin section sequence. The asterisk indicates the same section of the low-magnification panel (upper). Arrows indicate synaptic transmission direction. Red and blue areas indicate the locations and sizes of synaptic sites (red, PSD of the labeled cell; blue, PSD of a paired MT cell). Ax: axon-like structure. White scale bar = 500 nm (in D) and 1 μm (in E). Black scale bar = 500 nm (in D), 1 μm (low-magnification photo in E), and 500 nm (high-magnification photos in E).
Figure 4
Figure 4
Schematic summarizing RS location and function. (A) A simplified model of the MOB intrabulbar circuit. Mitral cells receive odor input from olfactory receptor neurons (ORN) and then send olfactory information to the olfactory cortex through the lateral olfactory tract (LOT). Mitral cells receive inhibitory input from mainly periglomerular (PG) and Gr cells. Gr cell spines form RSs with mitral cells primarily on secondary dendrites. This dendrodendritic signaling is driven by mitral cell soma depolarization. RSs act through lateral inhibition and self inhibition after depolarization for effective discrimination. Black arrow indicates the dendritic conduction of excitatory odor cues. (B) A simplified model of the AOB intrabulbar circuit. MT cells receive chemical information from vomeronasal receptor neurons (VRN) through several glomeruli and then send the information to the medial amygdala (MeA). PG cells in the AOB are not as numerous as in the MOB. MT cells in the AOB form RSs with Gr cells on primary dendrites. RSs in the AOB act as gate keeper before relaying the chemical cue to cell somas. Black arrow indicates the dendritic conduction of excitatory chemical signals, and dotted line indicates the attenuation of excitation.

Similar articles

Cited by

References

    1. Abraham N. M., Egger V., Shimshek D. R., Renden R., Fukunaga I., Sprengel R., et al. (2010). Synaptic inhibition in the olfactory bulb accelerates odor discrimination in mice. Neuron 65, 399–411 10.1016/j.neuron.2010.01.009 - DOI - PMC - PubMed
    1. Brennan P. A. (1994). The effects of local inhibition of N-methyl-D-aspartate and AMPA/kainate receptors in the accessory olfactory bulb on the formation of an olfactory memory in mice. Neuroscience 60, 701–708 10.1016/0306-4522(94)90498-7 - DOI - PubMed
    1. Brennan P. A., Keverne E. B. (1989). Impairment of olfactory memory by local infusions of non-selective excitatory amino acid receptor antagonists into the accessory olfactory bulb. Neuroscience 33, 463–468 - PubMed
    1. Brennan P. A., Keverne E. B. (1997). Neural mechanisms of mammalian olfactory learning. Prog. Neurobiol. 51, 457–481 10.1016/S0301-0082(96)00069-X - DOI - PubMed
    1. Burd G. D. (1980). Myelinated dendrites and neuronal perikarya in the olfactory bulb of the mouse. Brain Res. 181, 450–454 10.1016/0006-8993(80)90628-9 - DOI - PubMed

LinkOut - more resources