

Interaction of short-term depression and firing dynamics in shaping single neuron encoding
- PMID: 23626533
- PMCID: PMC3630324
- DOI: 10.3389/fncom.2013.00041
Interaction of short-term depression and firing dynamics in shaping single neuron encoding
Abstract
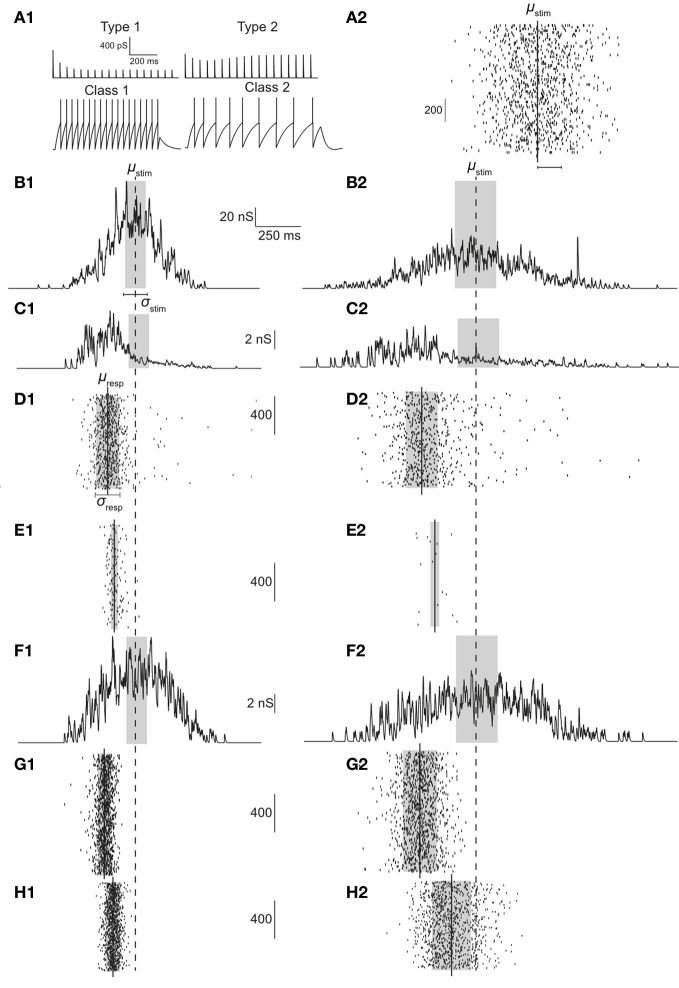
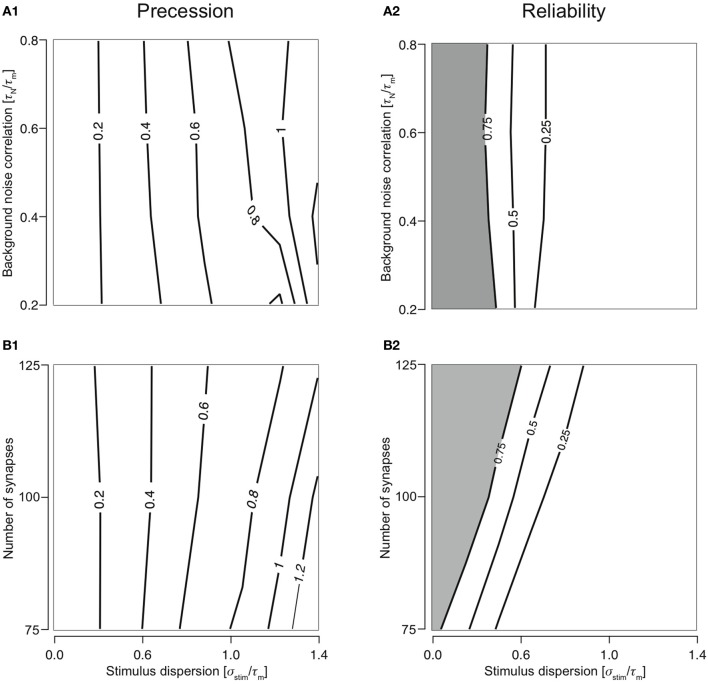
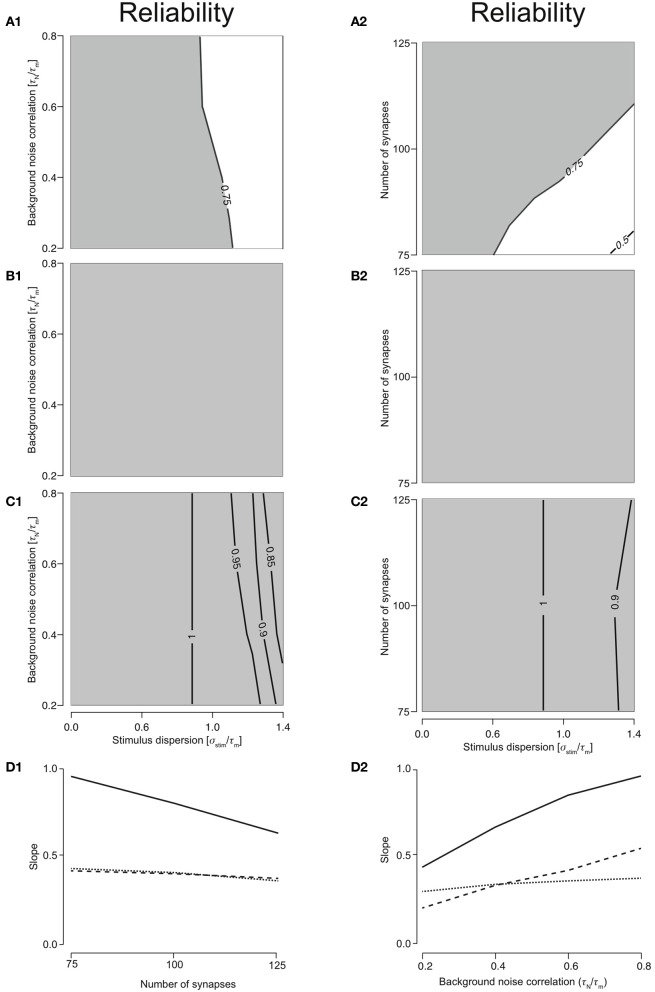
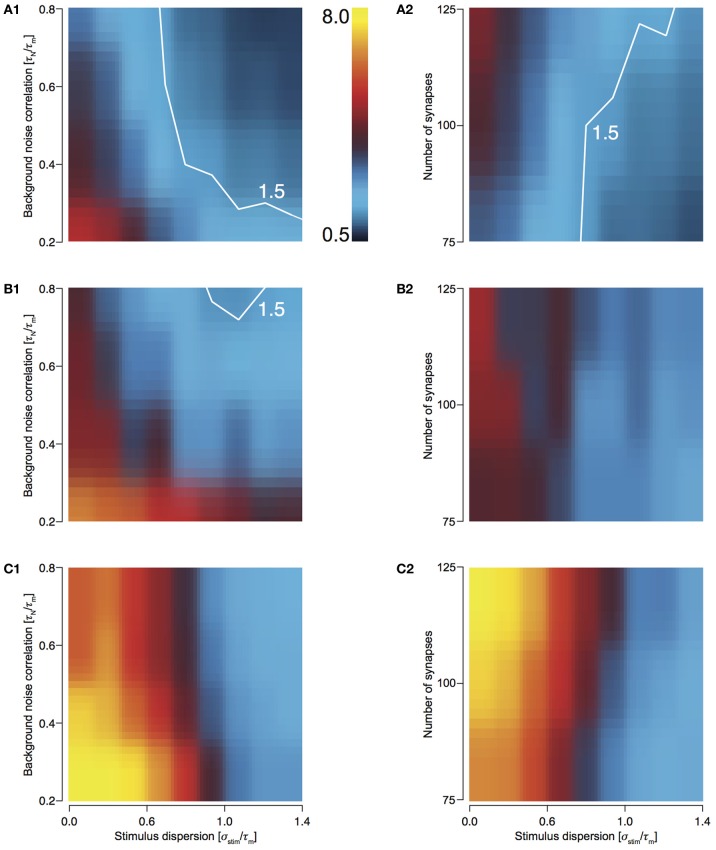
We investigated how the two properties short-term synaptic depression of afferent input and postsynaptic firing dynamics combine to determine the operating mode of a neuron. While several computational roles have been ascribed to either, their interaction has not been studied. We considered two types of short-term synaptic dynamics (release-dependent and release-independent depression) and two classes of firing dynamics (regular firing and firing with spike-frequency adaptation). The input-output transformation of the four possible combinations of pre- and post-synaptic dynamics was characterized. Adapting neurons receiving input from release-dependent synapses functioned largely as coincidence detectors. The other three configurations showed properties consistent with integrators, each with distinct features. These results suggest that the operating mode of a neuron is determined by both the pre- and post-synaptic dynamics and that studying them together is necessary to understand emergent properties and their implications for neuronal coding.
Keywords: emergent properties; firing properties; operating modes; short-term depression; synaptic integration.
Figures
Similar articles
-
Spike threshold adaptation diversifies neuronal operating modes in the auditory brain stem.J Neurophysiol. 2019 Dec 1;122(6):2576-2590. doi: 10.1152/jn.00234.2019. Epub 2019 Oct 2. J Neurophysiol. 2019. PMID: 31577531 Free PMC article.
-
A Slow Short-Term Depression at Purkinje to Deep Cerebellar Nuclear Neuron Synapses Supports Gain-Control and Linear Encoding over Second-Long Time Windows.J Neurosci. 2020 Jul 29;40(31):5937-5953. doi: 10.1523/JNEUROSCI.2078-19.2020. Epub 2020 Jun 17. J Neurosci. 2020. PMID: 32554551 Free PMC article.
-
Calcium coding and adaptive temporal computation in cortical pyramidal neurons.J Neurophysiol. 1998 Mar;79(3):1549-66. doi: 10.1152/jn.1998.79.3.1549. J Neurophysiol. 1998. PMID: 9497431
-
Integrator or coincidence detector? The role of the cortical neuron revisited.Trends Neurosci. 1996 Apr;19(4):130-7. doi: 10.1016/s0166-2236(96)80019-1. Trends Neurosci. 1996. PMID: 8658595 Review.
-
Spike timing and synaptic dynamics at the awake thalamocortical synapse.Prog Brain Res. 2005;149:91-105. doi: 10.1016/S0079-6123(05)49008-1. Prog Brain Res. 2005. PMID: 16226579 Review.
Cited by
-
Mathematical analysis and algorithms for efficiently and accurately implementing stochastic simulations of short-term synaptic depression and facilitation.Front Comput Neurosci. 2013 May 10;7:58. doi: 10.3389/fncom.2013.00058. eCollection 2013. Front Comput Neurosci. 2013. PMID: 23675343 Free PMC article.
-
Phase changes in neuronal postsynaptic spiking due to short term plasticity.PLoS Comput Biol. 2017 Sep 22;13(9):e1005634. doi: 10.1371/journal.pcbi.1005634. eCollection 2017 Sep. PLoS Comput Biol. 2017. PMID: 28937977 Free PMC article.
-
Interplay between Subthreshold Oscillations and Depressing Synapses in Single Neurons.PLoS One. 2016 Jan 5;11(1):e0145830. doi: 10.1371/journal.pone.0145830. eCollection 2016. PLoS One. 2016. PMID: 26730737 Free PMC article.
-
Neural spike-timing patterns vary with sound shape and periodicity in three auditory cortical fields.J Neurophysiol. 2016 Apr;115(4):1886-904. doi: 10.1152/jn.00784.2015. Epub 2016 Feb 3. J Neurophysiol. 2016. PMID: 26843599 Free PMC article.
-
Neural adaptation and fractional dynamics as a window to underlying neural excitability.PLoS Comput Biol. 2023 Feb 21;19(2):e1010527. doi: 10.1371/journal.pcbi.1010527. eCollection 2023 Feb. PLoS Comput Biol. 2023. PMID: 36809353 Free PMC article.
References
-
- Abbott L. F. (1997). Synaptic depression and cortical gain control. Science 275, 221–224 - PubMed
LinkOut - more resources
Full Text Sources
Other Literature Sources