Mapping of MN1 sequences necessary for myeloid transformation
- PMID: 23626719
- PMCID: PMC3634013
- DOI: 10.1371/journal.pone.0061706
Mapping of MN1 sequences necessary for myeloid transformation
Abstract
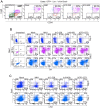
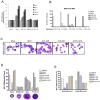
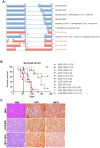
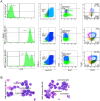
The MN1 oncogene is deregulated in human acute myeloid leukemia and its overexpression induces proliferation and represses myeloid differentiation of primitive human and mouse hematopoietic cells, leading to myeloid leukemia in mouse models. To delineate the sequences within MN1 necessary for MN1-induced leukemia, we tested the transforming capacity of in-frame deletion mutants, using retroviral transduction of mouse bone marrow. We found that integrity of the regions between amino acids 12 to 458 and 1119 to 1273 are required for MN1's in vivo transforming activity, generating myeloid leukemia with some mutants also producing T-cell lympho-leukemia and megakaryocytic leukemia. Although both full length MN1 and a mutant that lacks the residues between 12-228 (Δ12-228 mutant) repressed myeloid differentiation and increased myeloproliferative activity in vitro, the mutant lost its transforming activity in vivo. Both MN1 and Δ12-228 increased the frequency of common myeloid progentiors (CMP) in vitro and microarray comparisons of purified MN1-CMP and Δ12-228-CMP cells showed many differentially expressed genes including Hoxa9, Meis1, Myb, Runx2, Cebpa, Cebpb and Cebpd. This collection of immediate MN1-responsive candidate genes distinguishes the leukemic activity from the in vitro myeloproliferative capacity of this oncoprotein.
Conflict of interest statement
Figures


Similar articles
-
Conditional MN1-TEL knock-in mice develop acute myeloid leukemia in conjunction with overexpression of HOXA9.Blood. 2005 Dec 15;106(13):4269-77. doi: 10.1182/blood-2005-04-1679. Epub 2005 Aug 16. Blood. 2005. PMID: 16105979 Free PMC article.
-
MN1 overexpression induces acute myeloid leukemia in mice and predicts ATRA resistance in patients with AML.Blood. 2007 Sep 1;110(5):1639-47. doi: 10.1182/blood-2007-03-080523. Epub 2007 May 9. Blood. 2007. PMID: 17494859 Clinical Trial.
-
Modeling the functional heterogeneity of leukemia stem cells: role of STAT5 in leukemia stem cell self-renewal.Blood. 2009 Nov 5;114(19):3983-93. doi: 10.1182/blood-2009-06-227603. Epub 2009 Aug 10. Blood. 2009. PMID: 19667399
-
[Key molecular mechanisms associated with cell malignant transformation in acute myeloid leukemia].Mol Biol (Mosk). 2016 May-Jun;50(3):395-405. doi: 10.7868/S002689841602018X. Mol Biol (Mosk). 2016. PMID: 27414778 Review. Russian.
-
MN1, a novel player in human AML.Blood Cells Mol Dis. 2007 Nov-Dec;39(3):336-9. doi: 10.1016/j.bcmd.2007.06.009. Epub 2007 Aug 14. Blood Cells Mol Dis. 2007. PMID: 17698380 Free PMC article. Review.
Cited by
-
AMKL chimeric transcription factors are potent inducers of leukemia.Leukemia. 2017 Oct;31(10):2228-2234. doi: 10.1038/leu.2017.51. Epub 2017 Feb 8. Leukemia. 2017. PMID: 28174417 Free PMC article.
-
Refinement of Risk-Stratification of Cytogenetically Normal Acute Myeloid Leukemia Adult Patients by MN1 Expression.Asian Pac J Cancer Prev. 2024 Jul 1;25(7):2283-2289. doi: 10.31557/APJCP.2024.25.7.2283. Asian Pac J Cancer Prev. 2024. PMID: 39068559 Free PMC article.
-
Cell fate decisions in malignant hematopoiesis: leukemia phenotype is determined by distinct functional domains of the MN1 oncogene.PLoS One. 2014 Nov 17;9(11):e112671. doi: 10.1371/journal.pone.0112671. eCollection 2014. PLoS One. 2014. PMID: 25401736 Free PMC article.
-
GFI1B, EVI5, MYB--additional genes that cooperate with the human BCL6 gene to promote the development of lymphomas.Blood Cells Mol Dis. 2014 Jan;52(1):68-75. doi: 10.1016/j.bcmd.2013.07.003. Epub 2013 Jul 30. Blood Cells Mol Dis. 2014. PMID: 23910958 Free PMC article.
-
Role of Meningioma 1 for maintaining the transformed state in MLL-rearranged acute myeloid leukemia: potential for therapeutic intervention?Haematologica. 2020 May;105(5):1174-1176. doi: 10.3324/haematol.2019.246348. Haematologica. 2020. PMID: 32358078 Free PMC article. No abstract available.
References
-
- Rosenbauer F, Tenen DG (2007) Transcription factors in myeloid development: balancing differentiation with transformation. Nat Rev Immunol 7: 105–117. - PubMed
-
- Gilliland DG (2001) Hematologic malignancies. Curr Opin Hematol 8: 189–191. - PubMed
-
- Buijs A, Sherr S, van Baal S, van Bezouw S, van der Plas D, et al. (1995) Translocation (12;22) (p13;q11) in myeloproliferative disorders results in fusion of the ETS-like TEL gene on 12p13 to the MN1 gene on 22q11. Oncogene 10: 1511–1519. - PubMed
-
- Valk PJ, Verhaak RG, Beijen MA, Erpelinck CA, Barjesteh van Waalwijk van Doorn-Khosrovani S, et al. (2004) Prognostically useful gene-expression profiles in acute myeloid leukemia. N Engl J Med 350: 1617–1628. - PubMed
Publication types
MeSH terms
Substances
Grants and funding
LinkOut - more resources
Full Text Sources
Other Literature Sources
Medical
Molecular Biology Databases

