. 2013 Apr 23;8(4):e61770.
doi: 10.1371/journal.pone.0061770. Print 2013.

Filter characteristics influencing circulating tumor cell enrichment from whole blood

Affiliations

Filter characteristics influencing circulating tumor cell enrichment from whole blood

Frank A W Coumans et al. PLoS One. .

Abstract

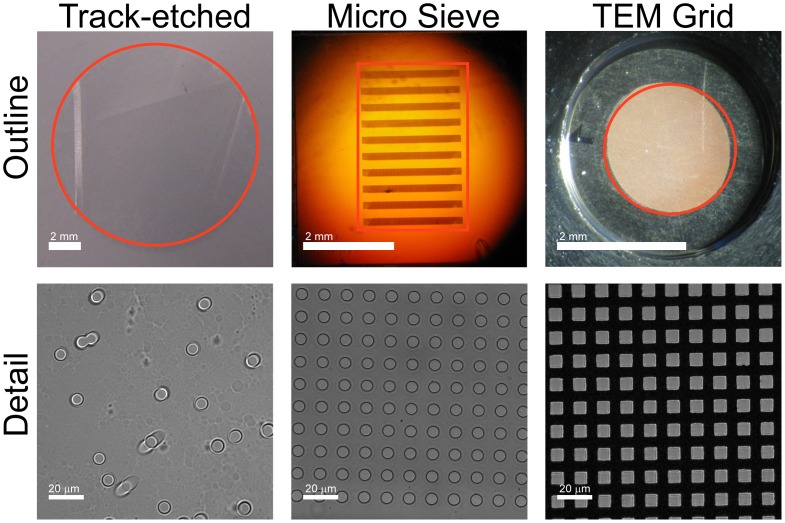
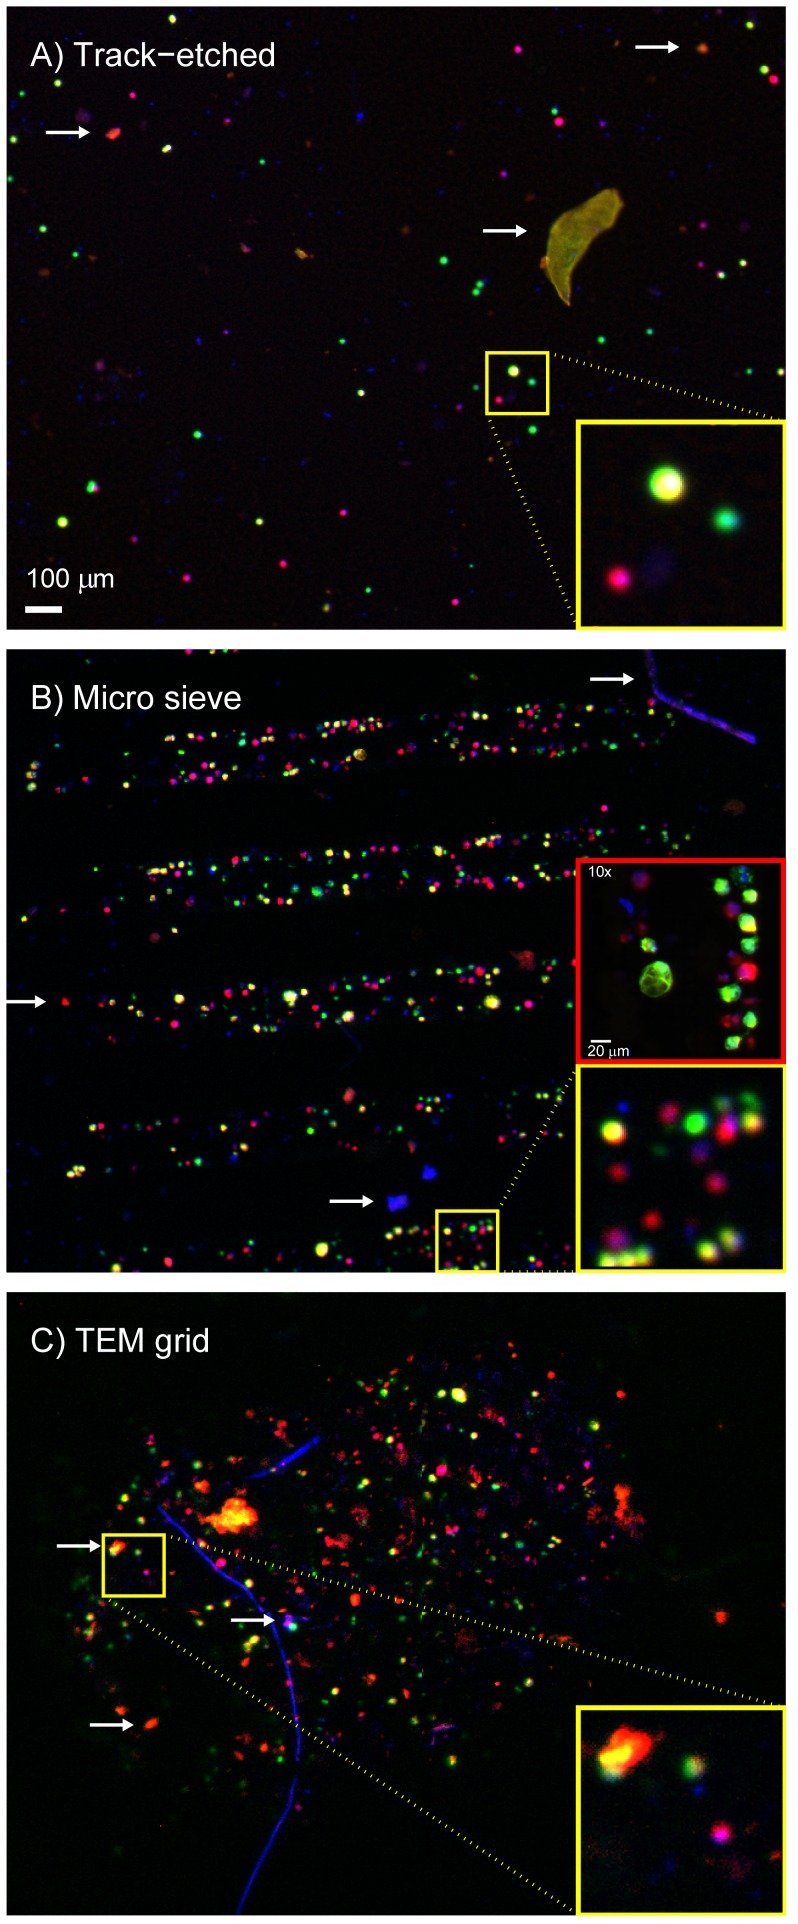
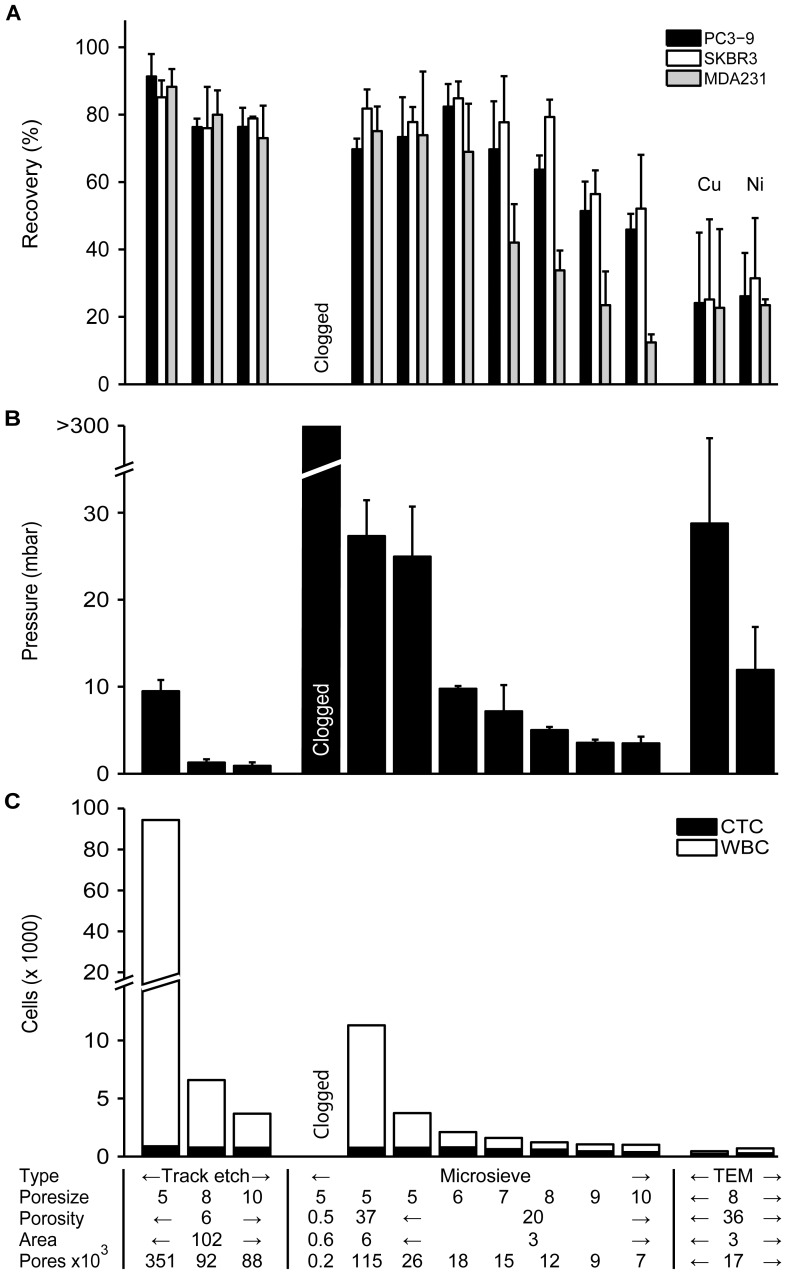
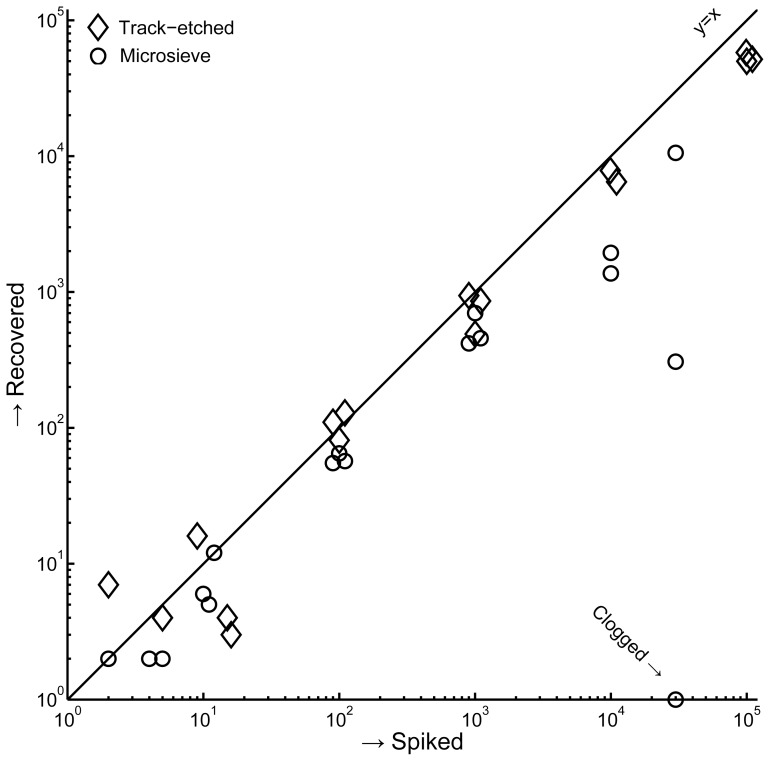
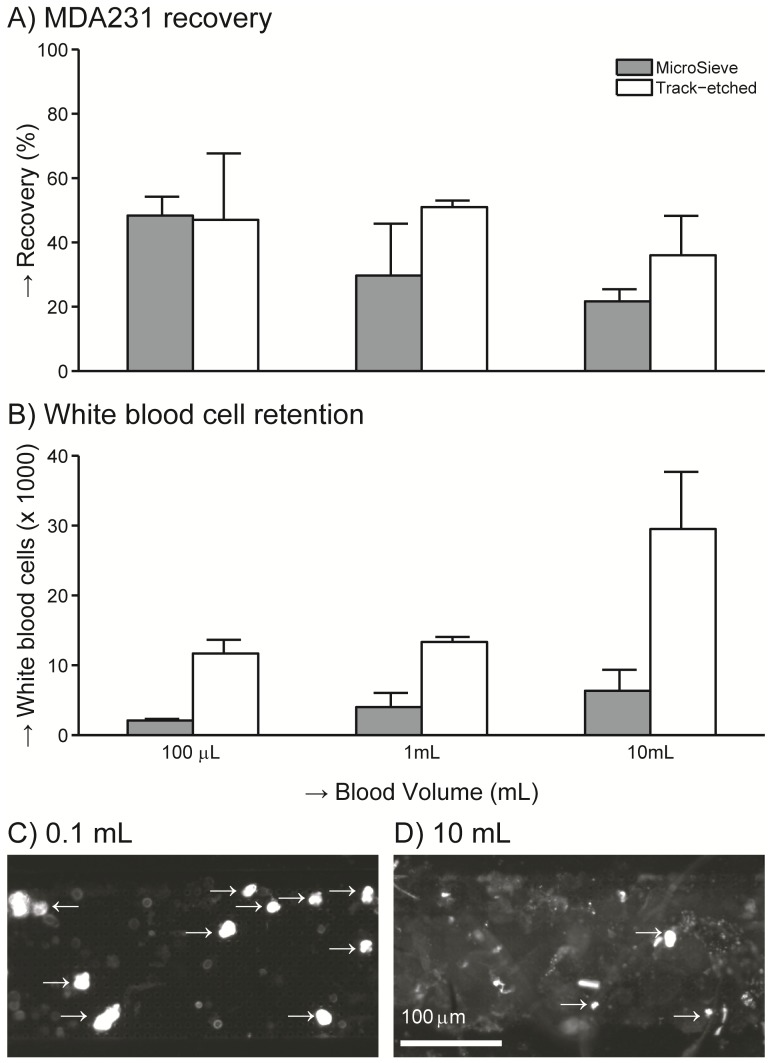
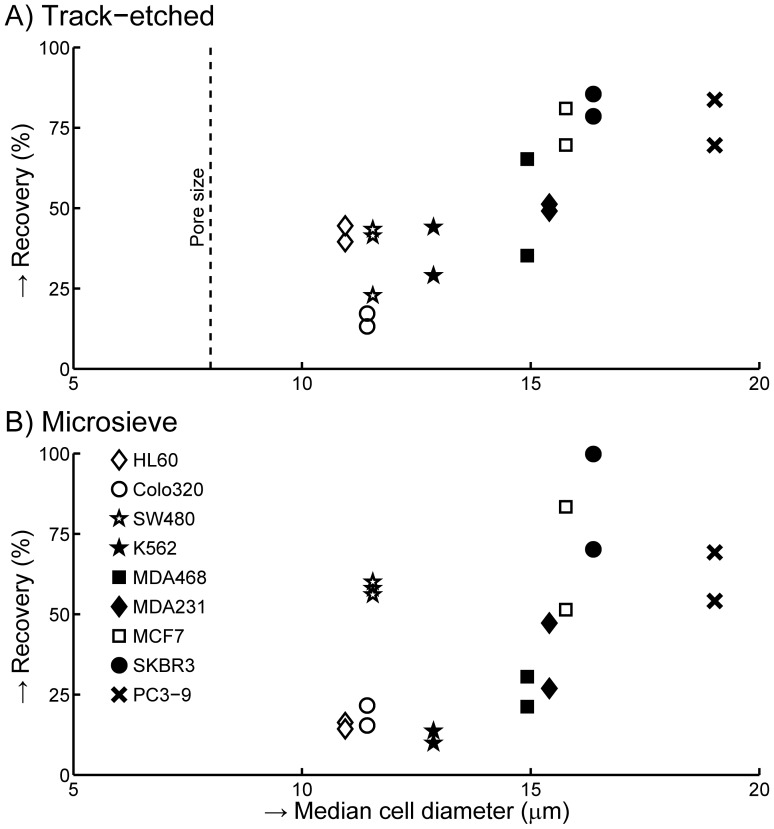
A variety of filters assays have been described to enrich circulating tumor cells (CTC) based on differences in physical characteristics of blood cells and CTC. In this study we evaluate different filter types to derive the properties of the ideal filter for CTC enrichment. Between 0.1 and 10 mL of whole blood spiked with cells from tumor cell lines were passed through silicon nitride microsieves, polymer track-etched filters and metal TEM grids with various pore sizes. The recovery and size of 9 different culture cell lines was determined and compared to the size of EpCAM+CK+CD45-DNA+ CTC from patients with metastatic breast, colorectal and prostate cancer. The 8 µm track-etched filter and the 5 µm microsieve had the best performance on MDA-231, PC3-9 and SKBR-3 cells, enriching >80% of cells from whole blood. TEM grids had poor recovery of ∼25%. Median diameter of cell lines ranged from 10.9-19.0 µm, compared to 13.1, 10.7, and 11.0 µm for breast, prostate and colorectal CTC, respectively. The 11.4 µm COLO-320 cell line had the lowest recovery of 17%. The ideal filter for CTC enrichment is constructed of a stiff, flat material, is inert to blood cells, has at least 100,000 regularly spaced 5 µm pores for 1 ml of blood with a ≤10% porosity. While cell size is an important factor in determining recovery, other factors must be involved as well. To evaluate a filtration procedure, cell lines with a median size of 11-13 µm should be used to challenge the system.


Conflict of interest statement

Competing Interests: The authors have read the journal’s policy and have the following conflicts: Veridex LLC provided funding for this study. LT served as a paid consultant for Veridex LLC within the last three years. There are no patents, products in development or marketed products to declare. This does not alter the authors’ adherence to all the PLOS ONE policies on sharing data and materials.

Figures

Figure 1
Figure 1. Overview of compared filters.
The outline images show a photograph of the track-etch filter, the microsieve and the transmission electron microscopy (TEM) grid. The perforated area of each filter is indicated in red. The microsieve contains perforated horizontal bars alternated by support bars, giving rise to the horizontal pattern. The detail shows dark field images for the three filters. Spacing of the pores is random for the track-etch filters, leading to occasional double pores. Microsieves and TEM grids have periodical pore spacing.
Figure 2
Figure 2. Images of cells on all filters.
Panel A shows a track-etched filter, panel B a microsieve filter and panel C a TEM grid filter. The images show false color fluorescent images taken of pre-stained cells enriched from a whole blood sample. Hoechst 33342 stain is shown in blue, Celltracker Orange in red, and Celltracker Green in green. In the false color MDA-231 cells are red, PC3-9 cells green and SKBR-3 cells yellow. Several types of autofluorescent and/or Hoechst positive debris were found on the filters, examples are indicated with white arrows. This debris is also found in unspiked samples. Due to the low number of pores and the high porosity of the microsieves and TEM grids, cells are very close to each other. To better distinguish cells on these filters, imaging with a 10x objective was necessary for determination of cell recovery as shown in the red insert in panel B. This was not possible with the track-etched filters because they were not sufficiently flat to have all cells in focus.
Figure 3
Figure 3. Comparison between different filter types.
Panel A shows recovery for SKBR-3, PC3-9 and MDA-231 cell lines. Bar height represents recovery with whiskers showing 1 standard deviation. No recovery was determined for the 0.5% porosity microsieve due to clogging while filtering. Panel B shows the peak pressure achieved during filtration. Whiskers show 1 standard deviation. Panel C shows the number of nucleated cells on the filter, with the CTC fraction also shown. The X-axis summarizes the major differences between the filters and applies to all panels.
Figure 4
Figure 4. Linearity of recovery for 8 µm track-etched filters and 5 µm microsieves.
Whole blood was spiked with 2, 10, 100, 1000, 10000, 30000 (microsieve only) or 100,000 (track-etch only) MDA-231. For spikes with target values of 2 and 10 cells, we determined the actual number of cells by microscope inspection of the cell drop prior to spiking. The counted spikes are shown, not the targets. Spikes of 104 cells and higher were counted automatically. Spikes of 100 and higher were offset by up to 10% to enhance readability of the graph.
Figure 5
Figure 5. Impact of total blood volume.
Recovery of 300 MDA-231 cells spiked into 0.1, 1 and 10 mL of whole blood determined on 5 µm microsieves and 8 µm track-etched filters. Panel A shows the % recovery of MDA-231 cells, panel B the number of white cells found on the filter. The images in panel C and D show the CellTracker Orange signal after microsieve filtration of 0.1 and 10 mL of whole spiked blood respectively. The saturated dots indicated with the arrows are counted as MDA-231 cells, the weaker fluorescence is autofluorescent material.
Figure 6
Figure 6. Size distribution of blood cells and various cancer cell lines.
Blood cells include white and red blood cells and the hematopoetic cell lines HL-60 and K-562. Cancer cell lines include prostate cancer cell lines PC3-9, colorectal cancer cell lines COLO-320 and SW-480, breast cancer cell lines SKBR-3, MCF7, MDA-231 and MDA-468. Distributions are normalized to unit area. Vertical lines indicate the median size for each cell type. Panel A shows the size distribution as determined using a Coulter pipette. Panel B shows the size distribution as determined using image analysis for MDA-231, SKBR-3, PC3-9, leukocytes (WBC) and CTC from patients with metastatic breast (CTC-B, solid line), colorectal (CTC-C, dotted line) or prostate (CTC-P, dashed line) cancer.
Figure 7
Figure 7. Recovery of different cell lines.
300 cells of each cell line were spiked into 1 mL of whole blood. Recovery obtained with 8 µm track-etched filters is shown in panel A, recovery with 5 µm microsieves is shown in panel B.

Similar articles

Cited by

References

    1. Cristofanilli M, Budd GT, Ellis MJ, Stopeck A, Matera J, et al. (2004) Circulating tumor cells, disease progression, and survival in metastatic breast cancer. N Engl J Med 351: 781–791. - PubMed
    1. Pierga JY, Hajage D, Bachelot T, Delaloge S, Brain E, et al. (2012) High independent prognostic and predictive value of circulating tumor cells compared with serum tumor markers in a large prospective trial in first-line chemotherapy for metastatic breast cancer patients. Ann Oncol 23: 618–24. - PubMed
    1. Tol J, Koopman M, Miller MC, Tibbe A, Cats A, et al. (2010) Circulating tumour cells early predict progression-free and overall survival in advanced colorectal cancer patients treated with chemotherapy and targeted agents. Ann Oncol 21: 1006–1012. - PubMed
    1. de Bono JS, Scher HI, Montgomery RB, Parker C, Miller MC, et al. (2008) Circulating Tumor Cells Predict Survival Benefit from Treatment in Metastatic Castration-Resistant Prostate Cancer. Clin Cancer Res 14: 6302–6309. - PubMed
    1. Rao C, Bui T, Connelly M, Doyle G, Karydis I, et al. (2011) Circulating melanoma cells and survival in metastatic melanoma. Int J Oncol 38: 755–760. - PubMed

Publication types