Cerebellar soluble mutant ataxin-3 level decreases during disease progression in Spinocerebellar Ataxia Type 3 mice
- PMID: 23626768
- PMCID: PMC3633920
- DOI: 10.1371/journal.pone.0062043
Cerebellar soluble mutant ataxin-3 level decreases during disease progression in Spinocerebellar Ataxia Type 3 mice
Abstract
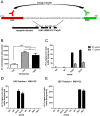
Spinocerebellar Ataxia Type 3 (SCA3), also known as Machado-Joseph disease, is an autosomal dominantly inherited neurodegenerative disease caused by an expanded polyglutamine stretch in the ataxin-3 protein. A pathological hallmark of the disease is cerebellar and brainstem atrophy, which correlates with the formation of intranuclear aggregates in a specific subset of neurons. Several studies have demonstrated that the formation of aggregates depends on the generation of aggregation-prone and toxic intracellular ataxin-3 fragments after proteolytic cleavage of the full-length protein. Despite this observed increase in aggregated mutant ataxin-3, information on soluble mutant ataxin-3 levels in brain tissue is lacking. A quantitative method to analyze soluble levels will be a useful tool to characterize disease progression or to screen and identify therapeutic compounds modulating the level of toxic soluble ataxin-3. In the present study we describe the development and application of a quantitative and easily applicable immunoassay for quantification of soluble mutant ataxin-3 in human cell lines and brain samples of transgenic SCA3 mice. Consistent with observations in Huntington disease, transgenic SCA3 mice reveal a tendency for decrease of soluble mutant ataxin-3 during disease progression in fractions of the cerebellum, which is inversely correlated with aggregate formation and phenotypic aggravation. Our analyses demonstrate that the time-resolved Förster resonance energy transfer immunoassay is a highly sensitive and easy method to measure the level of soluble mutant ataxin-3 in biological samples. Of interest, we observed a tendency for decrease of soluble mutant ataxin-3 only in the cerebellum of transgenic SCA3 mice, one of the most affected brain regions in Spinocerebellar Ataxia Type 3 but not in whole brain tissue, indicative of a brain region selective change in mutant ataxin-3 protein homeostasis.
Conflict of interest statement
Figures


Similar articles
-
Calpain-mediated ataxin-3 cleavage in the molecular pathogenesis of spinocerebellar ataxia type 3 (SCA3).Hum Mol Genet. 2013 Feb 1;22(3):508-18. doi: 10.1093/hmg/dds449. Epub 2012 Oct 24. Hum Mol Genet. 2013. PMID: 23100324
-
Mutant ataxin-3 with an abnormally expanded polyglutamine chain disrupts dendritic development and metabotropic glutamate receptor signaling in mouse cerebellar Purkinje cells.Cerebellum. 2014 Feb;13(1):29-41. doi: 10.1007/s12311-013-0516-5. Cerebellum. 2014. PMID: 23955261
-
Overexpression of mutant ataxin-3 in mouse cerebellum induces ataxia and cerebellar neuropathology.Cerebellum. 2013 Aug;12(4):441-55. doi: 10.1007/s12311-012-0432-0. Cerebellum. 2013. PMID: 23242710
-
Progress in pathogenesis studies of spinocerebellar ataxia type 1.Philos Trans R Soc Lond B Biol Sci. 1999 Jun 29;354(1386):1079-81. doi: 10.1098/rstb.1999.0462. Philos Trans R Soc Lond B Biol Sci. 1999. PMID: 10434309 Free PMC article. Review.
-
Mutant Ataxin-3-Containing Aggregates (MATAGGs) in Spinocerebellar Ataxia Type 3: Dynamics of the Disorder.Mol Neurobiol. 2021 Jul;58(7):3095-3118. doi: 10.1007/s12035-021-02314-z. Epub 2021 Feb 24. Mol Neurobiol. 2021. PMID: 33629274 Review.
Cited by
-
Calpain-1 ablation partially rescues disease-associated hallmarks in models of Machado-Joseph disease.Hum Mol Genet. 2020 Apr 15;29(6):892-906. doi: 10.1093/hmg/ddaa010. Hum Mol Genet. 2020. PMID: 31960910 Free PMC article.
-
Cerebral Organoids: A Human Model for AAV Capsid Selection and Therapeutic Transgene Efficacy in the Brain.Mol Ther Methods Clin Dev. 2020 Jun 1;18:167-175. doi: 10.1016/j.omtm.2020.05.028. eCollection 2020 Sep 11. Mol Ther Methods Clin Dev. 2020. PMID: 32637448 Free PMC article.
-
From mice to men: lessons from mutant ataxic mice.Cerebellum Ataxias. 2014 Jun 16;1:4. doi: 10.1186/2053-8871-1-4. eCollection 2014. Cerebellum Ataxias. 2014. PMID: 26331028 Free PMC article. Review.
-
PolyQ-expanded ataxin-3 protein levels in peripheral blood mononuclear cells correlate with clinical parameters in SCA3: a pilot study.J Neurol. 2021 Apr;268(4):1304-1315. doi: 10.1007/s00415-020-10274-y. Epub 2020 Oct 26. J Neurol. 2021. PMID: 33106888 Free PMC article.
-
State biomarkers for Machado Joseph disease: Validation, feasibility and responsiveness to change.Genet Mol Biol. 2019;42(1 suppl 1):238-251. doi: 10.1590/1678-4685-GMB-2018-0103. Epub 2019 Jun 10. Genet Mol Biol. 2019. PMID: 31188927 Free PMC article.
References
-
- Riess O, Rüb U, Pastore A, Bauer P, Schöls L (2008) SCA3: neurological features, pathogenesis and animal models. Cerebellum 7: 125–137. - PubMed
-
- Michalik A, Van Broeckhoven C (2003) Pathogenesis of polyglutamine disorders: aggregation revisited. Hum Mol Genet 12 Spec No 2: R173–86. - PubMed
-
- Koch P, Breuer P, Peitz M, Jungverdorben J, Kesavan J, et al. (2011) Excitation-induced ataxin-3 aggregation in neurons from patients with Machado-Joseph disease. Nature 480: 543–546. - PubMed
Publication types
MeSH terms
Substances
LinkOut - more resources
Full Text Sources
Other Literature Sources

