. 2013 Apr 23;8(4):e62349.
doi: 10.1371/journal.pone.0062349. Print 2013.

Treatment of colorectal cancer using a combination of liposomal irinotecan (Irinophore C™) and 5-fluorouracil

Affiliations

Treatment of colorectal cancer using a combination of liposomal irinotecan (Irinophore C™) and 5-fluorouracil

Jennifer I Hare et al. PLoS One. .

Abstract

Purpose: To investigate the use of liposomal irinotecan (Irinophore C™) plus or minus 5-fluorouracil (5-FU) for the treatment of colorectal cancer.

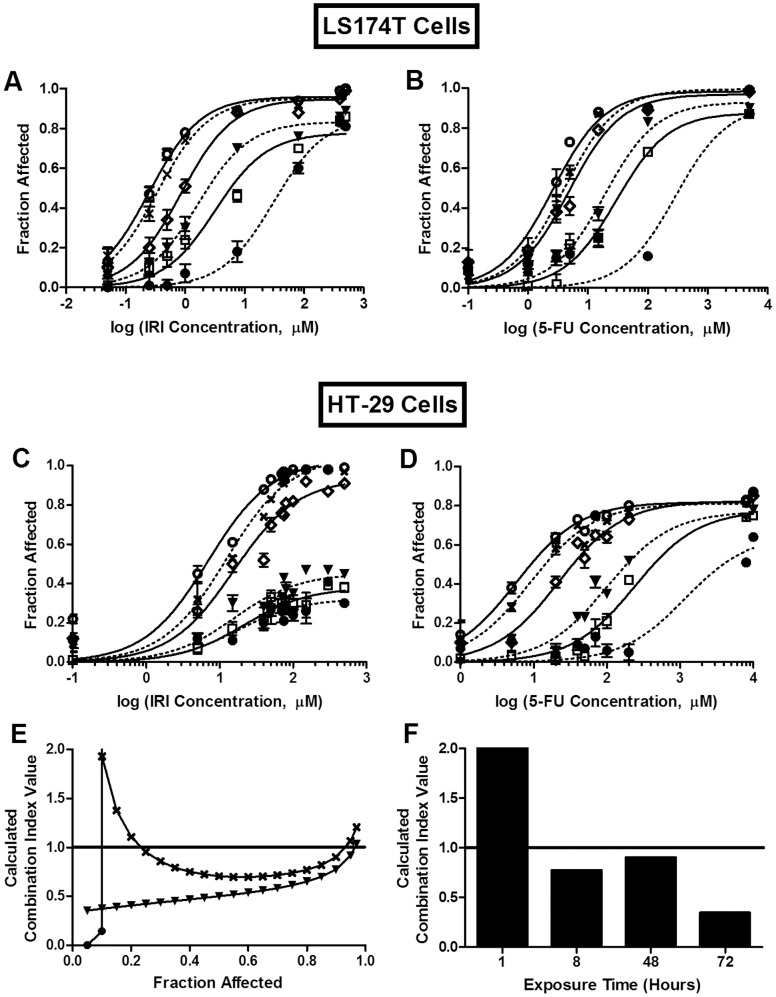
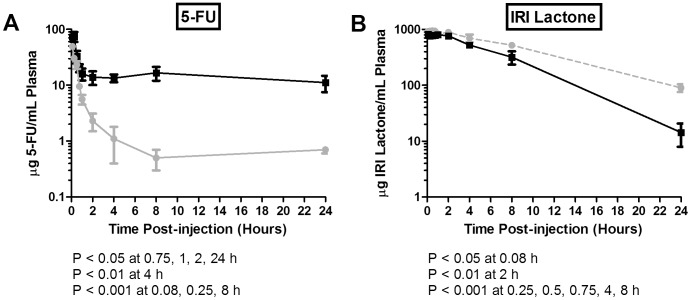
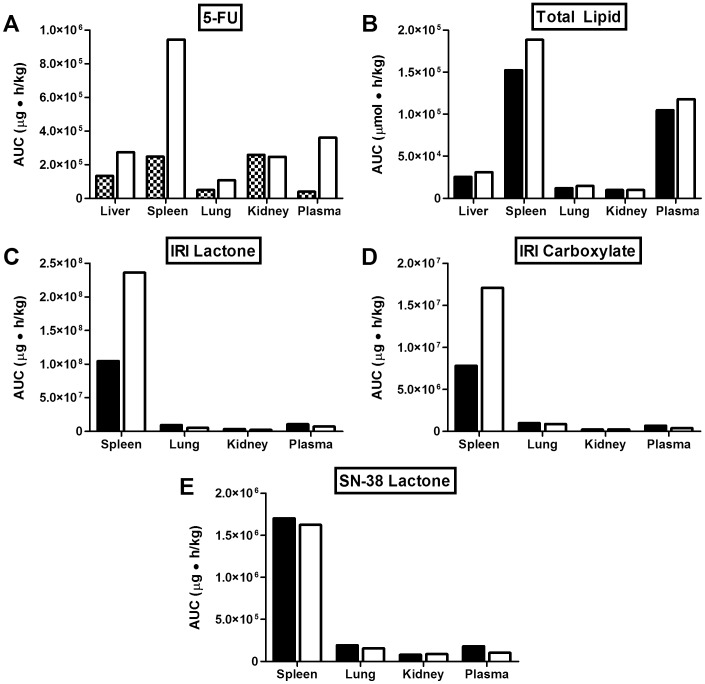
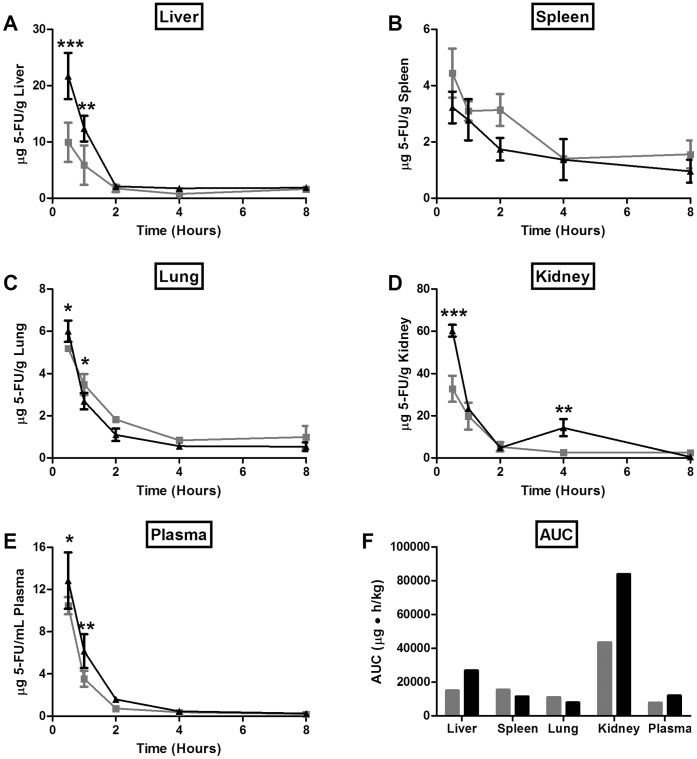
Experimental design: The effect of irinotecan (IRI) and/or 5-FU exposure times on cytotoxicity was assessed in vitro against HT-29 or LS174T human colon carcinoma cells. The pharmacokinetics and biodistribution of Irinophore C™ (IrC™) and 5-FU, administered alone or in combination, were compared in vivo. A subcutaneous model of HT-29 human colorectal cancer in Rag2-M mice was utilized to assess the efficacy of IrC™ alone, and in combination with 5-FU.

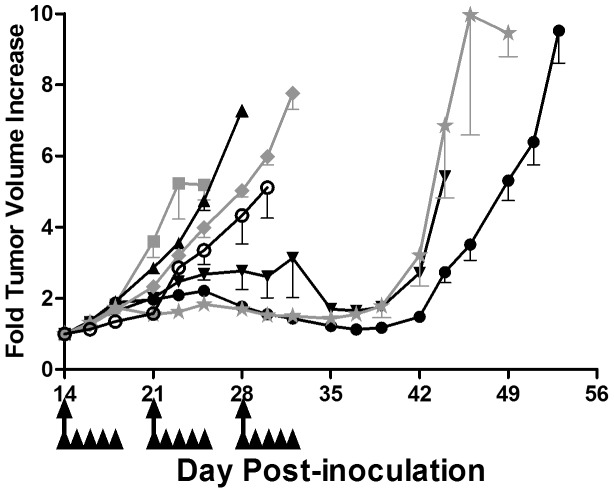
Results: The cytotoxicity of IRI and 5-FU were strongly dependent on exposure time. Synergistic interactions were observed following prolonged exposure to IRI/5-FU combinations. Pharmacokinetics/biodistribution studies demonstrated that the 5-FU elimination rate was decreased significantly when 5-FU was co-administered intravenously with IrC™, versus alone. Significant decreases in 5-FU elimination were also observed in plasma, with an associated increase of 5-FU in some tissues when 5-FU was given by intraperitoneal injection and IrC™ was given intravenously. The elimination of IrC™ was not significantly different when administered alone or in combination with 5-FU. Therapeutic studies demonstrated that single agent IrC™ was significantly more effective than the combination of IRI/5-FU; surprisingly, IrC™/5-FU combinations were no more effective than IrC™ alone. The administration of combinations of 5-FU (16 mg/kg) and IrC™ (60 mg IRI/kg) showed increased toxicity when compared to IrC™ alone. Treatment with IrC™ alone (60 mg IRI/kg) delayed the time required for a 5-fold increase in initial tumor volume to day 49, compared to day 23 for controls. When IrC™ (40 mg IRI/kg) was used in combination with 5-FU (16 mg/kg), the time to increase tumor volume 5-fold was 43 days, which was comparable to that achieved when using IrC™ alone (40 mg IRI/kg).

Conclusions: Single agent IrC™ was well tolerated and has significant therapeutic potential. IrC™ may be a suitable replacement for IRI treatment, but its use with free 5-FU is complicated by IrC™-engendered changes in 5-FU pharmacokinetics/biodistribution which are associated with increased toxicity when using the combination.


Conflict of interest statement

Competing Interests: The authors have declared that no competing interests exist.

Figures

Figure 1
Figure 1. Exposure time dependency of IRI and/or 5-FU cytotoxicity in vitro.
A–D) Single agent exposure time dependency. LS174T (A and B) and HT-29 (C and D) cells were exposed to IRI (A and C) or 5-FU (B and D) for 1 (•, dotted line), 4 (, solid line), 8 (▾, dotted line) 24 (, solid line), 48 (X, dotted line), or 72 h (○, solid line). E) Combination exposure time dependency. HT-29 cells were exposed to IRI/5-FU (1∶1 molar ratio) for 1 h (•), 8 h (▾), or 48 h (X). F) Calculated CI values at FA = 0.9 for HT-29 cells exposed to IRI/5-FU (1∶1 molar ratio) for 1–72 h. A–D) Each point represents the mean +/− standard deviation (n = 3–9) from 2–3 experiments, each completed in triplicate. E, F) Each point or bar represents a combination index value calculated from cytotoxicity data compiled from 2–4 separate experiments, each completed in triplicate. CI of 0.8 to 1.2 suggests additive interactions; CI <0.8 suggests synergistic interactions; and CI >1.2 suggests antagonistic interactions.
Figure 2
Figure 2. Plasma clearance of 5-FU and IrC™ administered as single agents or co-administered.
Mice were injected i.v. with radio-labeled 5-FU (40 mg/kg) or IrC™ (40 mg IRI/kg), or both agents simultaneously. At various time points post-injection, the plasma concentrations of 5-FU and IRI (lactone) were determined. A) Mean plasma concentration of 5-FU +/− standard deviation (n = 4) after administration alone (solid gray line) or after co-administration with IrC™ (solid black line). B) Mean plasma concentration of IRI lactone +/− standard deviation (n = 4) after administration of IrC™ alone (dashed gray line) or after co-administration of IrC™ with 5-FU (solid black line).
Figure 3
Figure 3. Mean AUC0–24h of 5-FU and IrC™ administered i.v. as single agents or co-administered.
Mice were injected i.v. with radio-labeled 5-FU (40 mg/kg; hatched bars) or IrC™ (40 mg IRI/kg; black bars), or both agents simultaneously (white bars). At various time points post-injection, the plasma and organ concentrations of the lipid and drug species were determined, and AUC0–24h values were calculated from the resulting concentration-time curves. Data are presented as mean plasma and organ area under the curve (0–24 h) (n = 4) for 5-FU (A), total lipid (B), IRI lactone (C), IRI carboxylate (D), and SN-38 lactone (E).
Figure 4
Figure 4. PK/BD of 5-FU administered i.p. as a single agent or co-administered with IrC™.
Mice were injected i.p. with 5-FU (16 mg/kg) on days 1 and 2 (gray line/bar); 5-FU was spiked with radio-labeled 5-FU on day 2. Half of the mice were also injected i.v. with IrC™ (60 mg IRI/kg) on day 1 (black line/bar), at 2 hours after the injection of 5-FU. At various time points post-injection, the plasma and tissue concentrations of 5-FU were determined, and AUC0–8h values were calculated from the resulting concentration-time curves. Data are presented as mean concentration of 5-FU in liver (A), spleen (B), lung (C), kidney (D), plasma (E) +/− standard deviation (n = 3), or mean plasma and organ area under the curve (0–8 h) (n = 3) for 5-FU (F).
Figure 5
Figure 5. Efficacy of IRI/5-FU and IrC™/5-FU treatment in the HT-29 s.c. model of CRC.
Mice bearing s.c. HT-29 tumors were treated with saline+D5W (grey solid square), 5-FU (16 mg/kg; black solid upright triangle), IRI (60 mg/kg; grey solid diamond), IrC™ (40 or 60 mg IRI/kg; black solid inverted triangle or black solid circle, respectively), IRI +5-FU (60 mg/kg +16 mg/kg; black open circle), or IrC™ +5-FU (40 mg IRI/kg +16 mg/kg; grey solid star). Beginning on day 14, D5W and 5-FU were administered QD×5 (x 3 weeks) via i.p. injection (arrowheads); all other treatments were administered Q7D×3 via i.v. injection (full arrows). Data are presented as mean fold tumor volume increase +/− standard error of the mean (n = 6).

References

    1. Jemal A, Bray F (2011) Center MM, Ferlay J, Ward E, et al (2011) Global cancer statistics. CA Cancer J Clin 61: 69–90. - PubMed
    1. American Cancer Society (2008) Global Cancer Facts & Figures 2nd Edition. Atlanta: American Cancer Society.
    1. Ferlay J, Shin HR, Bray F, Forman D, Mathers C, et al. (2010) Estimates of worldwide burden of cancer in 2008: GLOBOCAN 2008. Int J Cancer 127: 2893–2917. - PubMed
    1. American Cancer Society (2013) Cancer Facts & Figures 2013. Atlanta: American Cancer Society.
    1. American Cancer Society (2011) Colorectal Cancer Facts & Figures 2011–2013. Atlanta: American Cancer Society.

Publication types

MeSH terms