. 2012 May 25;1(1):3.
doi: 10.1167/tvst.1.1.3.

The Nature of Macular Damage in Glaucoma as Revealed by Averaging Optical Coherence Tomography Data

Affiliations

The Nature of Macular Damage in Glaucoma as Revealed by Averaging Optical Coherence Tomography Data

Donald C Hood et al. Transl Vis Sci Technol. .

Abstract

Purpose: To better understand the nature of glaucomatous damage, especially to the macula, the inner retinal thickness maps obtained with frequency domain optical coherence tomography (fdOCT) were averaged.

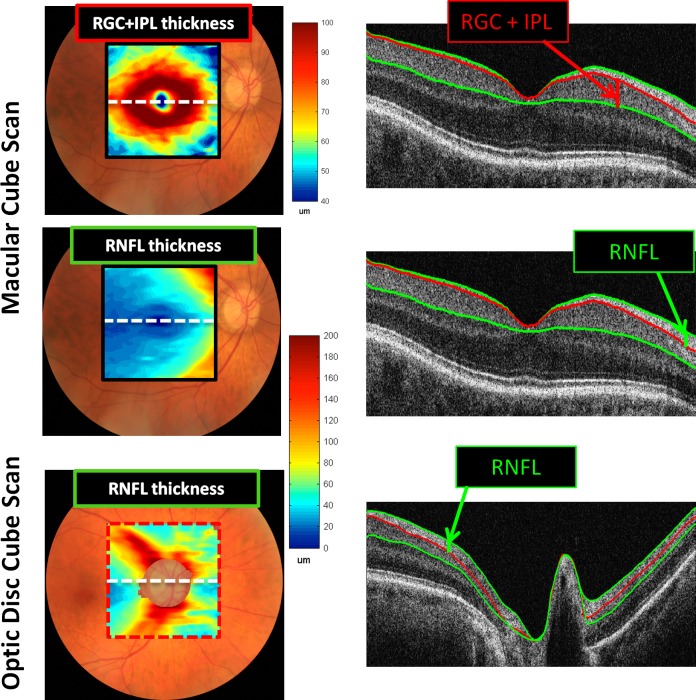
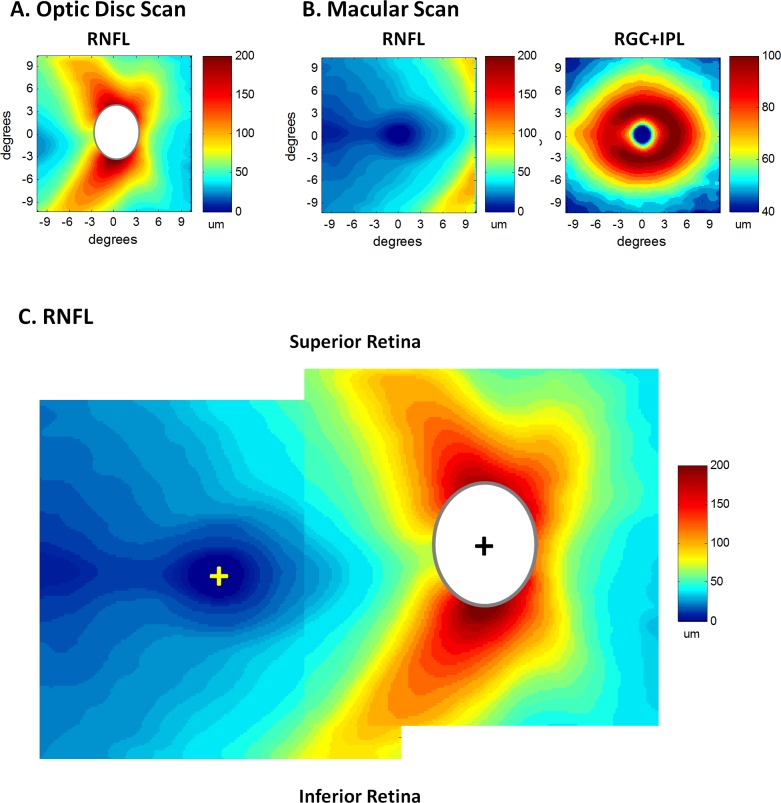
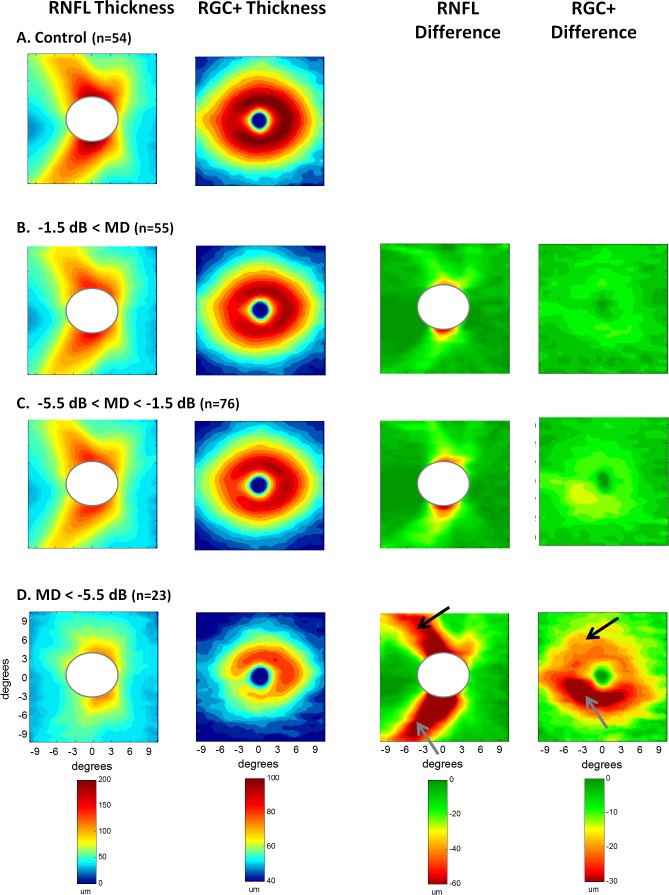
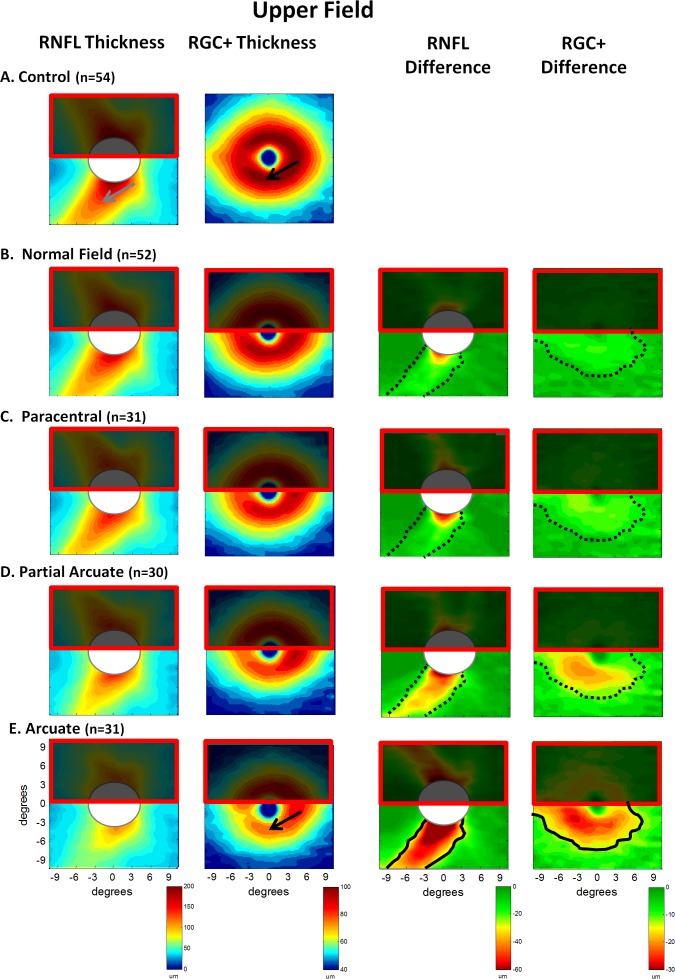
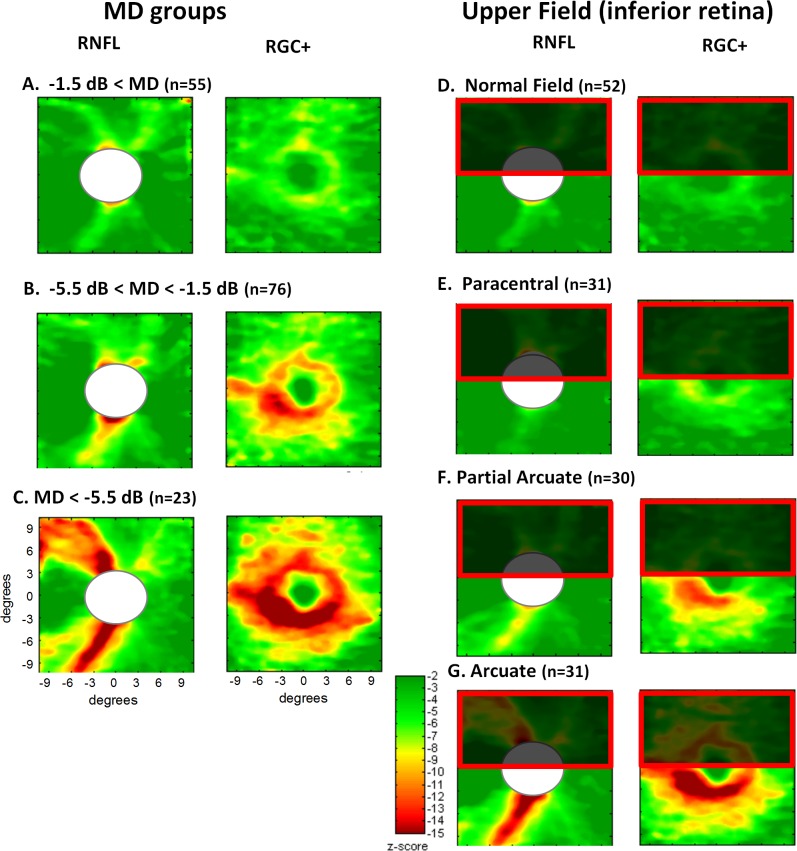
Methods: Frequency domain optical coherence tomography macular and optic disc cube scans were obtained from 54 healthy eyes and 156 eyes with glaucomatous optic neuropathy. A manually corrected algorithm was used for layer segmentation. Patients' eyes were grouped both by mean deviation (MD) and hemifield classification using standard categories and 24-2 (6° grid) visual fields (VFs). To obtain average difference maps, the thickness of retinal nerve fiber (RNF) and retinal ganglion cell plus inner plexiform (RGC+) layers were averaged and subtracted from the average control values.

Results: On the average difference maps, RGC+ and RNF layer thinning was seen in the patient groups with VFs classified as normal. The pattern of the thinning was the same, but the degree of thinning increased with decreased MD and with classification category (from normal to arcuate). This RGC+ thinning was largely within the central four points of the 24-2 (6° grid) field, after correcting for RGC displacement.

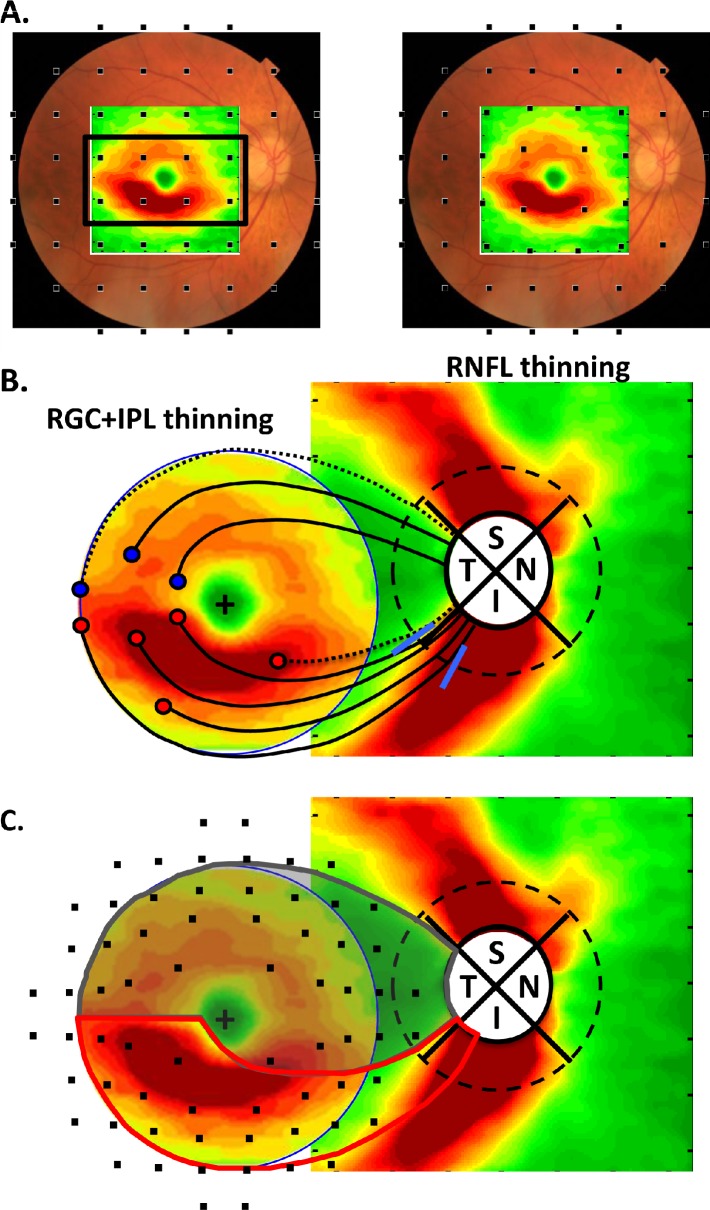
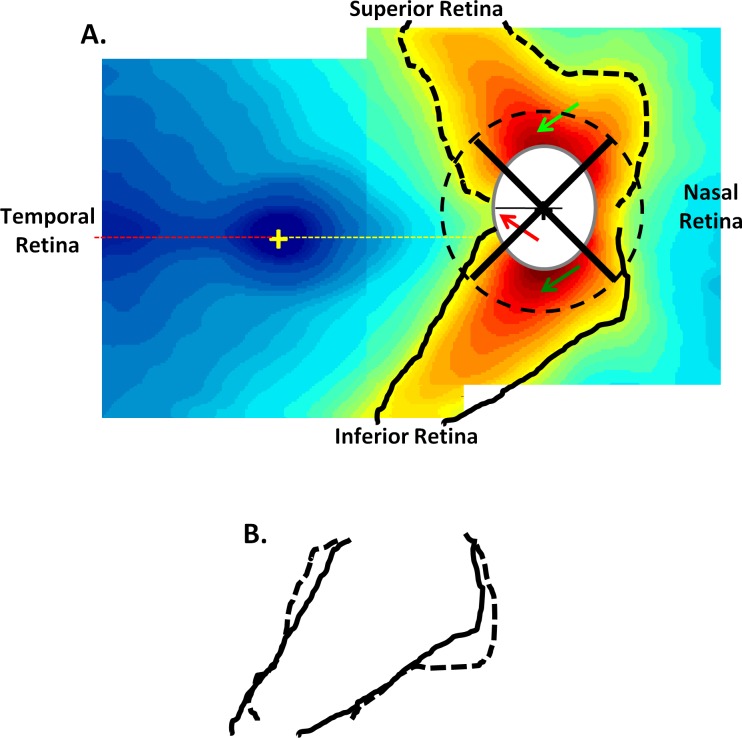
Conclusion: 1. VF categories represent different degrees of the same pattern of RGC+ and RNFL layer thinning. 2. RGC+ damage occurs in the central macula even in patients with VFs classified as normal. 3. The 6° grid (24-2) pattern is not optimally designed to detect macular damage. 4. A schematic model of RGC projections is proposed to explain the pattern of macular loss, including the greater vulnerability of the inferior retinal region.

Translational relevance: The 24-2 is not an optimal test pattern for detecting or following glaucomatous damage. Further, we suggest clinical fdOCT reports include RGC+ and RNFL probability plots combined with VF information.

Keywords: glaucoma; macula; optical coherence tomography; perimetry; visual fields.


Figures

Figure 1.
Figure 1.
Left column: RGC+IPL and RNFL thickness maps shown in pseudo-color for the fdOCT cube scans of the macular and optic disc. Right column: Midline horizontal B-scans illustrating the borders segmented and the layers measured.
Figure 2.
Figure 2.
(A) The average RNFL thickness map from the optic disc scans of the healthy control eyes. (B) The average RNFL (left) and RGC+IPL (right) thickness maps from the macular scans of the healthy control eyes. (C) The RNFL maps from panels A and B are superimposed by aligning the foveal (yellow +) and disc (black +) centers. Because disc sizes vary, the white ellipsoid masks the central region on the disc scan where data for at least 95% of the controls did not exist.
Figure 3.
Figure 3.
Results are shown for the healthy controls (A) and for the patients' eyes grouped according to MD of the 24-2 visual field, better than −1.5 MD (B); between −1.5 and −5.5 dB (C); and worse than −5.5 dB (D). The left two columns show the thickness maps of the RNFL of the disc scan and RGC+IPL of the macular scan. The right two columns are the difference maps produced by subtracting the thickness map of the controls from the thickness map of the patient group. Because disc sizes vary, the white ellipsoids masks the central region on the disc scans where data for at least 95% of the controls and 95% of the patients did not exist.
Figure 4.
Figure 4.
Results are shown for the healthy controls (A) and for the patients' eyes grouped according to classification of the superior visual field, normal (no damage) (B); paracentral defect (C); partial arcuate defect (D); and arcuate defect (E). The left two columns show the thickness maps of the RNFL of the disc scan and RGC+ IP layers of the macular scan. The right two columns are the difference maps produced by subtracting the thickness map of the controls from the thickness map of the patient group. The solid black curves in the left two panels of E are iso-thickness contours. These are superimposed on the panels above (dotted curves).
Figure 5.
Figure 5.
The difference plots from Figures 3 and 4 are shown here converted to z scores using the SEs of the patient and control groups.
Figure 6.
Figure 6.
(A) The difference (thinning) plot for the RGC+ IP layers of the group with the MD < −5.5 dB from Figure 3D (rightmost panel) is shown with the test points of the 24-2. These points are positioned to coincide with the location of the RGC+IP layers activated as previously described., (B) The RGC+ IPL thinning map from A is combined with the RNFL thinning map for the same group. The dashed circle (diameter of 3.4 mm) is the locus of points used in most peripapillary scans. See text for details.
Figure 7.
Figure 7.
(A) The RNFL thickness maps from Figure 2C are shown with isocontour borders added. (B) These isocontours for the upper (dashed) and lower (solid) disc regions are compared by flipping the superior contours.

References

    1. Huang D, Swanson EA, Lin CP, et al. Optical coherence tomography. Science. 1991;254:1178–81. - PMC - PubMed
    1. Schuman JS, Hee MR, Puliafito CA, et al. Quantification of nerve fiber layer thickness in normal and glaucomatous eyes using optical coherence tomography. Arch Ophthalmol. 1995;113:586–96. - PubMed
    1. Garvin MK, Abramoff MD, Kardon R, Russell SR, Wu X, Sonka M. Intraretinal layer segmentation of macular optical coherence tomography images using optimal 3-D graph search. IEEE Trans Med Imaging. 2008;27:1495–505. - PMC - PubMed
    1. Garvin MK, Abramoff MD, Wu X, Russell SR, Burns TL, Sonka M. Automated 3-D intraretinal layer segmentation of macular spectral-domain optical coherence tomography images. IEEE Trans Med Imaging. 2009;28:1436–47. - PMC - PubMed
    1. Wang M, Hood DC, Cho JS, et al. Measurement of local retinal ganglion cell layer thickness in patients with glaucoma using frequency-domain optical coherence tomography. Arch Ophthalmol. 2009;127:875–81. - PMC - PubMed